When Dylan Fox limped off in the 32nd minute of Sydney FC’s recent ‘away’ game against Wellington Phoenix, it completed a rare treble for the Sky Blues. It was the third consecutive match in which Sydney’s opponents made a first-half substitution, following Tommy Oar (vs Central Coast) and both Luke Devere and Jack Hingert’s (vs Brisbane) early exits. In 444 competitive matches, Sydney FC’s opponents have made just 58 first-half subs.
This gives me an excuse to kick off this blog with a look at the pattern of substitutions in Sydney FC’s matches in detail. I’m going to restrict this to the A-League regular season in order to avoid complicated situations like two-legged matches, holding on for penalty shootouts and, recently, the possibility of being able to make an additional change in extra time. So we’re comparing like-with-like: each team has three subs to make during the 90 minutes.1
In 350 A-League regular season matches, Sydney FC has made 923 replacements while their opponents have made 942. Here’s a summary of how many subs each side has made in these matches:
| Opposition subs | |||||
|---|---|---|---|---|---|
| SFC subs | 0 | 1 | 2 | 3 | Total |
| 0 | 0 (0.0%) | 0 (0.0%) | 1 (0.3%) | 0 (0.0%) | 1 (0.3%) |
| 1 | 0 (0.0%) | 3 (0.9%) | 6 (1.7%) | 11 (3.1%) | 20 (5.7%) |
| 2 | 0 (0.0%) | 3 (0.9%) | 17 (4.9%) | 64 (18.3%) | 84 (24.0%) |
| 3 | 0 (0.0%) | 9 (2.6%) | 54 (15.4%) | 182 (52.0%) | 245 (70.0%) |
| Total | 0 (0.0%) | 15 (4.3%) | 78 (22.3%) | 257 (73.4%) | 350 |
Both sides have used all three replacements just over half the time, with Sydney tending to use fewer than their opponents (SFC used fewer subs in 82 matches; their opponent used fewer in 66). There’s been just one match in which either side finished with the same eleven they started with: during the tense Premiership race towards the end of the 2009–10 season, Vítězslav Lavička didn’t bring on any of his young bench players in the Round 20 scoreless draw away at Melbourne Victory. Ernie Merrick only made two subs during that match as well, with the first coming in the 83rd minute.
Timing of substitutions
So while Sydney FC has tended to use slightly fewer subs on average than their opponents, what about the timing of them?
Mean cumulative function
One way to look at this is to consider each minute of a match and plot the number of substitutions each side has made by that point. So we end up with a step chart that jumps at the time of each sub. Note that I’ve added a small random shift to the height of each line just so they don’t all overlap, and have highlighted the last three matches:
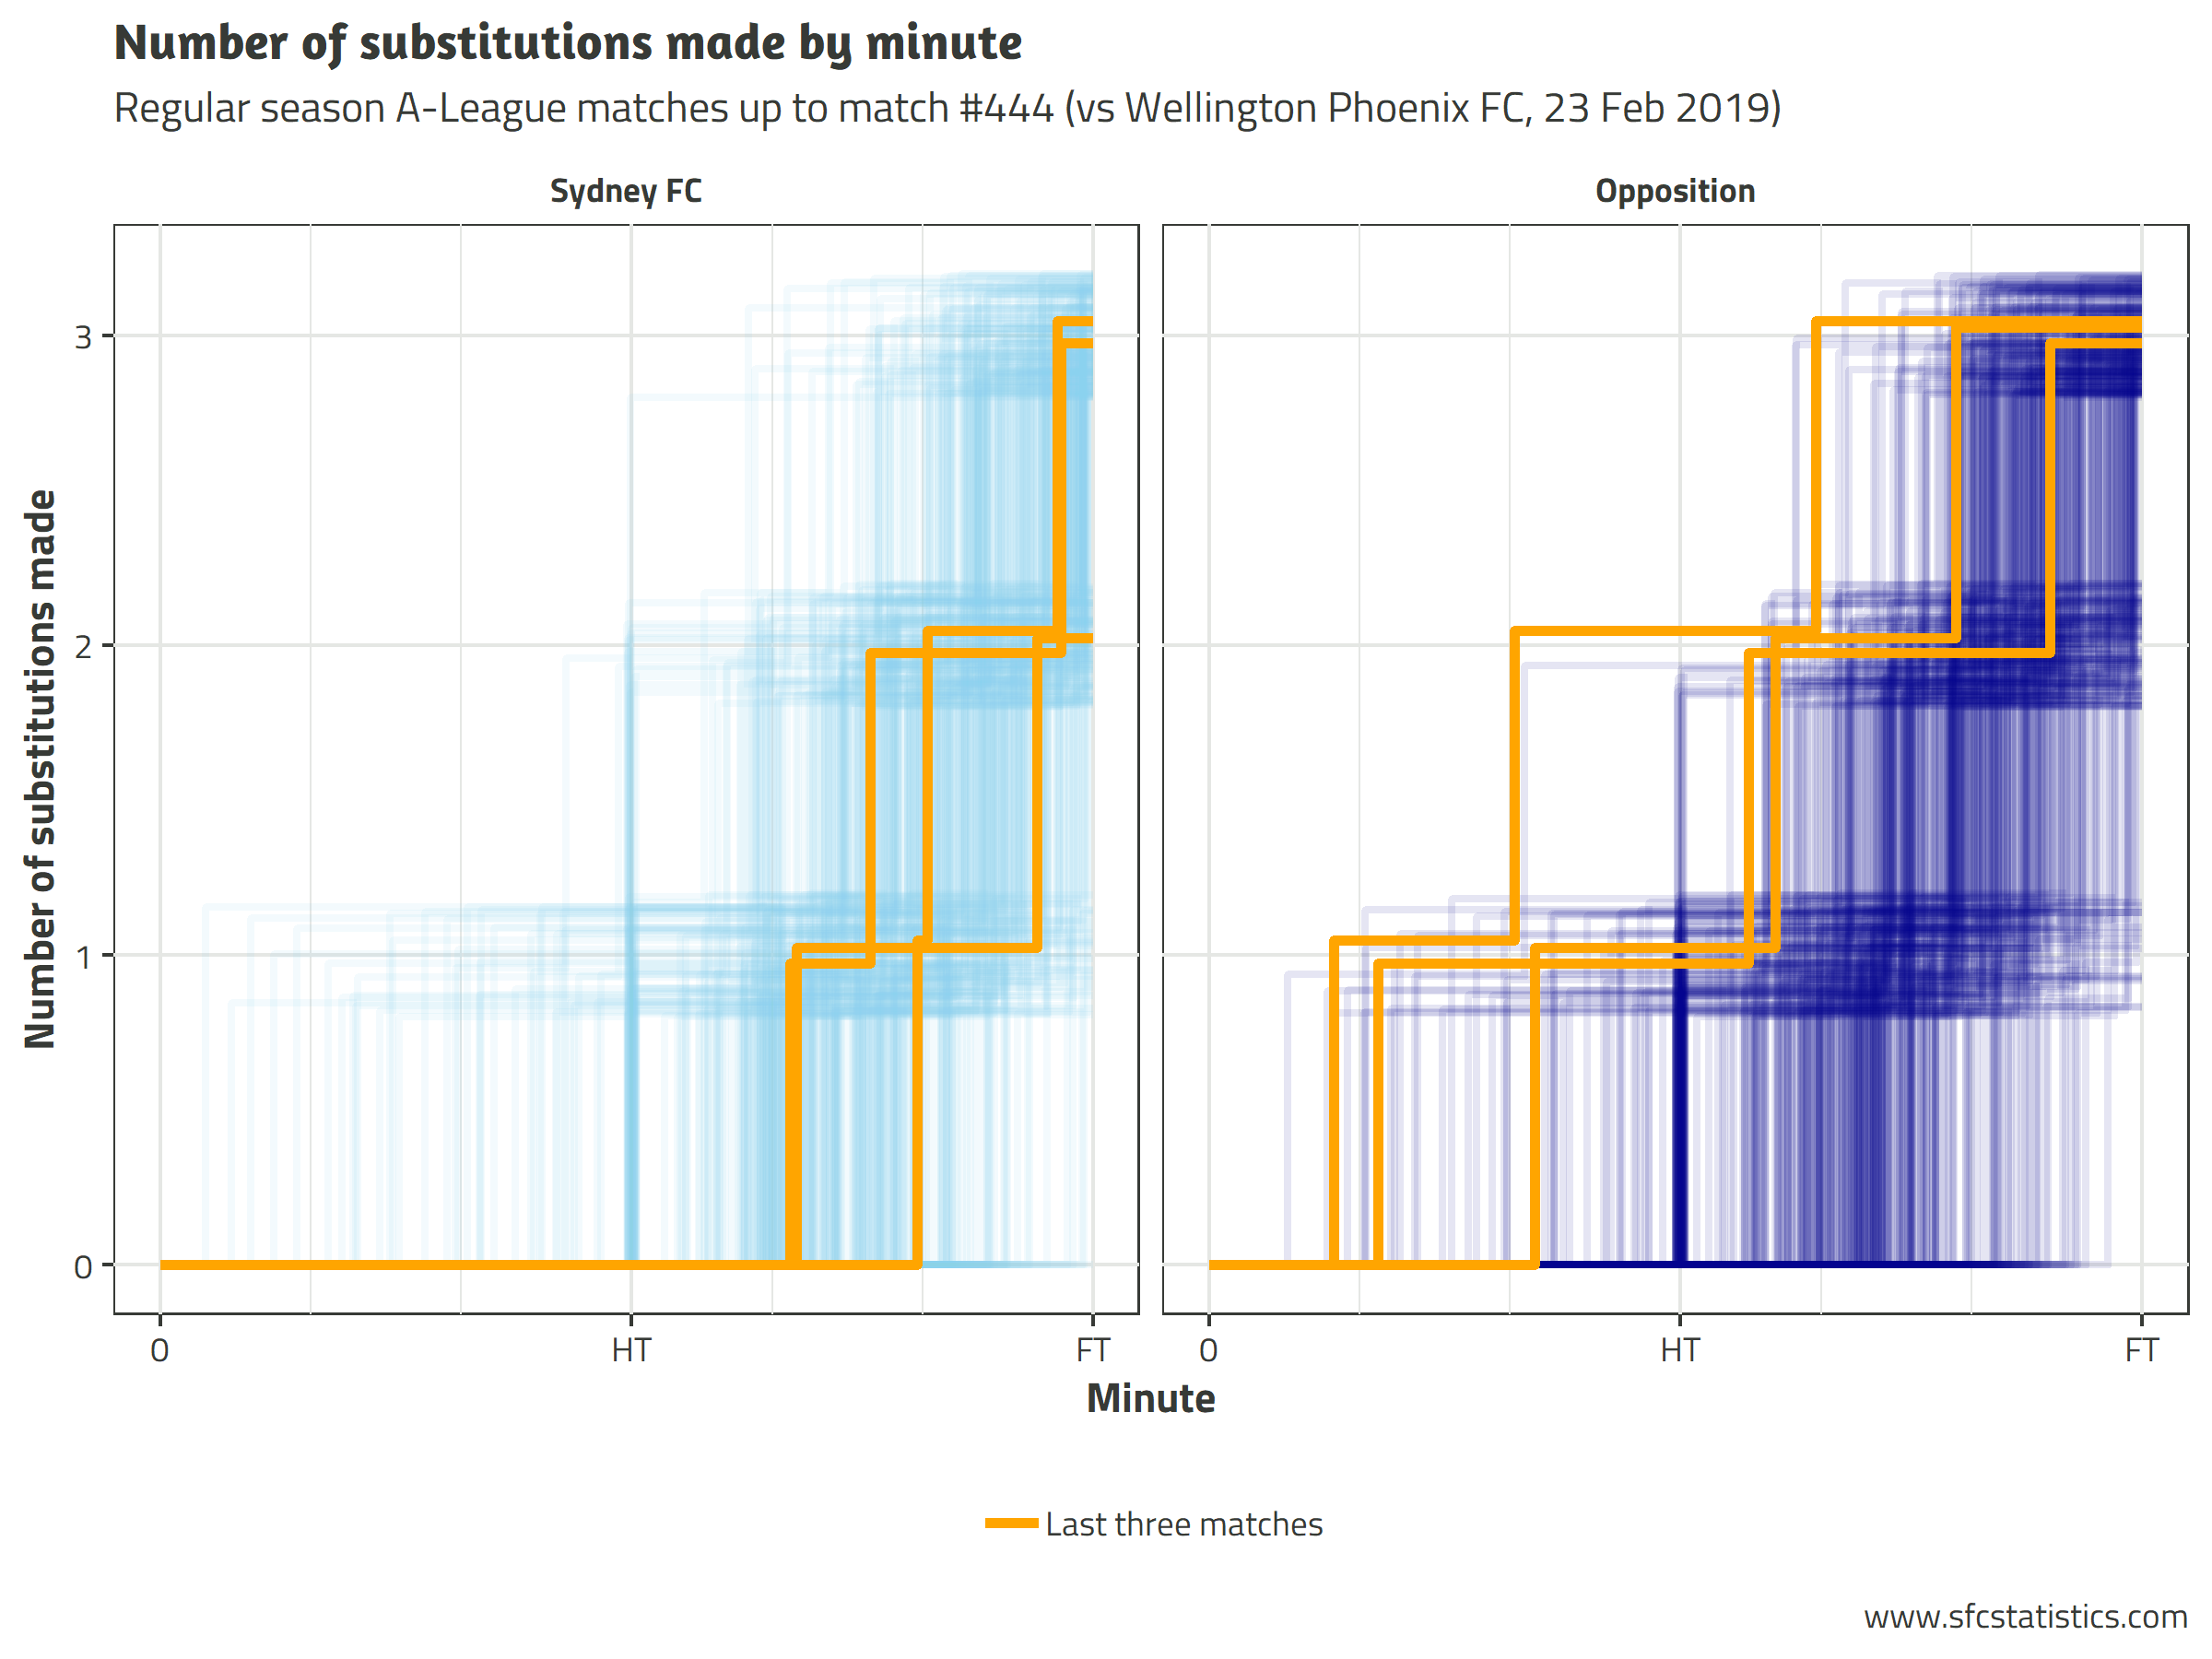
If we take the average of these curves, we get what is called the mean cumulative function: essentially the expected number of substitutions each side would have made at any given minute of a match.

The most noticeable thing about this graph is that the lines are pretty much on top of one another for the entire first half. At half-time, the opposition’s line jumps clearly above Sydney’s, and then remains there for the remainder of the match. The final jump just before full-time represents subs made in injury time at the end of the match, with Sydney FC closing the gap somewhat.
These two observations perhaps aren’t particularly surprising. Injury time subs tend to be made by the leading team in an attempt to waste a little time, and Sydney FC has won more games in the A-League than they have lost. Conversely, half-time subs are more often made by the team trailing:
| Half-time score | Matches | SFC HT subs (Avg) | Opp HT subs (Avg) |
|---|---|---|---|
| Opposition leading | 93 | 34 (0.37) | 6 (0.06) |
| Scores level | 142 | 7 (0.05) | 25 (0.18) |
| Sydney FC leading | 115 | 6 (0.05) | 34 (0.30) |
The surprising thing is that both Sydney FC and their opponents have made the same number of changes when trailing (34 each) and when leading (6 each), despite the fact that Sydney FC has led more often. The entirety of the half-time difference has come in the 142 matches in which the scores were level: Sydney FC has made just 7 subs compared to their opponents’ 25 in such a scenario.
Cumulative distribution function
For each minute, we can also calculate the proportion of matches in which each team has made 1, 2 or 3 substitutions by that time. This is called the cumulative distribution function. While it is related to the previous graphs, it is an alternative way of looking at the data that might reveal something different.

Again the Sydney curves are consistently lower than the opposition’s, reflecting the fact that Sydney tends to make fewer subs. What is perhaps interesting here is the times at which the curves diverge. As we saw before, the opposition tends to make their first change more often at half-time, their second comes more often just after 60 minutes, and their third around the 75th minute.
The curves all get much closer together by full-time, which means that Sydney had to catch up somewhere. Relative to the opponent’s curve, Sydney’s seems to speed up around 55–65 minutes for the first sub, and then only towards the end of the match for the second and third changes.
Split by manager
One criticism of Steve Corica that was often raised towards the beginning of this season was that he waited too long to make changes during a match. I can’t even attempt to answer that question with such a simple analysis, but I thought it might be interesting just to re-do the above plots separately for each of Sydney FC’s nine managers. I’ve only included Sydney’s curve because the manager only indirectly affects the opposition’s changes.
First, the mean cumulative function:

From this we can see that there seem to be three distinct groups of managers. The first two, Pierre Littbarski and Terry Butcher, were the most reticent to make early changes, with just one expected by the 75th minute. Around that time though, the curves diverge, with Litti expected to use almost his full complement by the end of the match, while Butcher typically only used two of his three.
On the other end of the spectrum sit Ian Crook and Frank Farina. Although Crook was only in charge for six matches, Sydney did not go so well in a few of them, which might explain his eagerness to make changes. Farina, on the other hand, sits right in the middle of the pack for A-League results with Sydney, so his fast substitution rate might have another explanation. It does appear that a large portion of his ‘gap’ to the chasing pack opened up at half-time, by which time he was expected to have made 0.5 changes (effectively one every two games).
The rest of the managers are nearly indistinguishable, and Steve Corica sits right in the middle of the bunch. Apart from having to make first-half subs slightly more often, his curve is almost identical to Sydney’s only Premiership-winning managers, Vítězslav Lavička and Graham Arnold.
In terms of the cumulative distribution function:
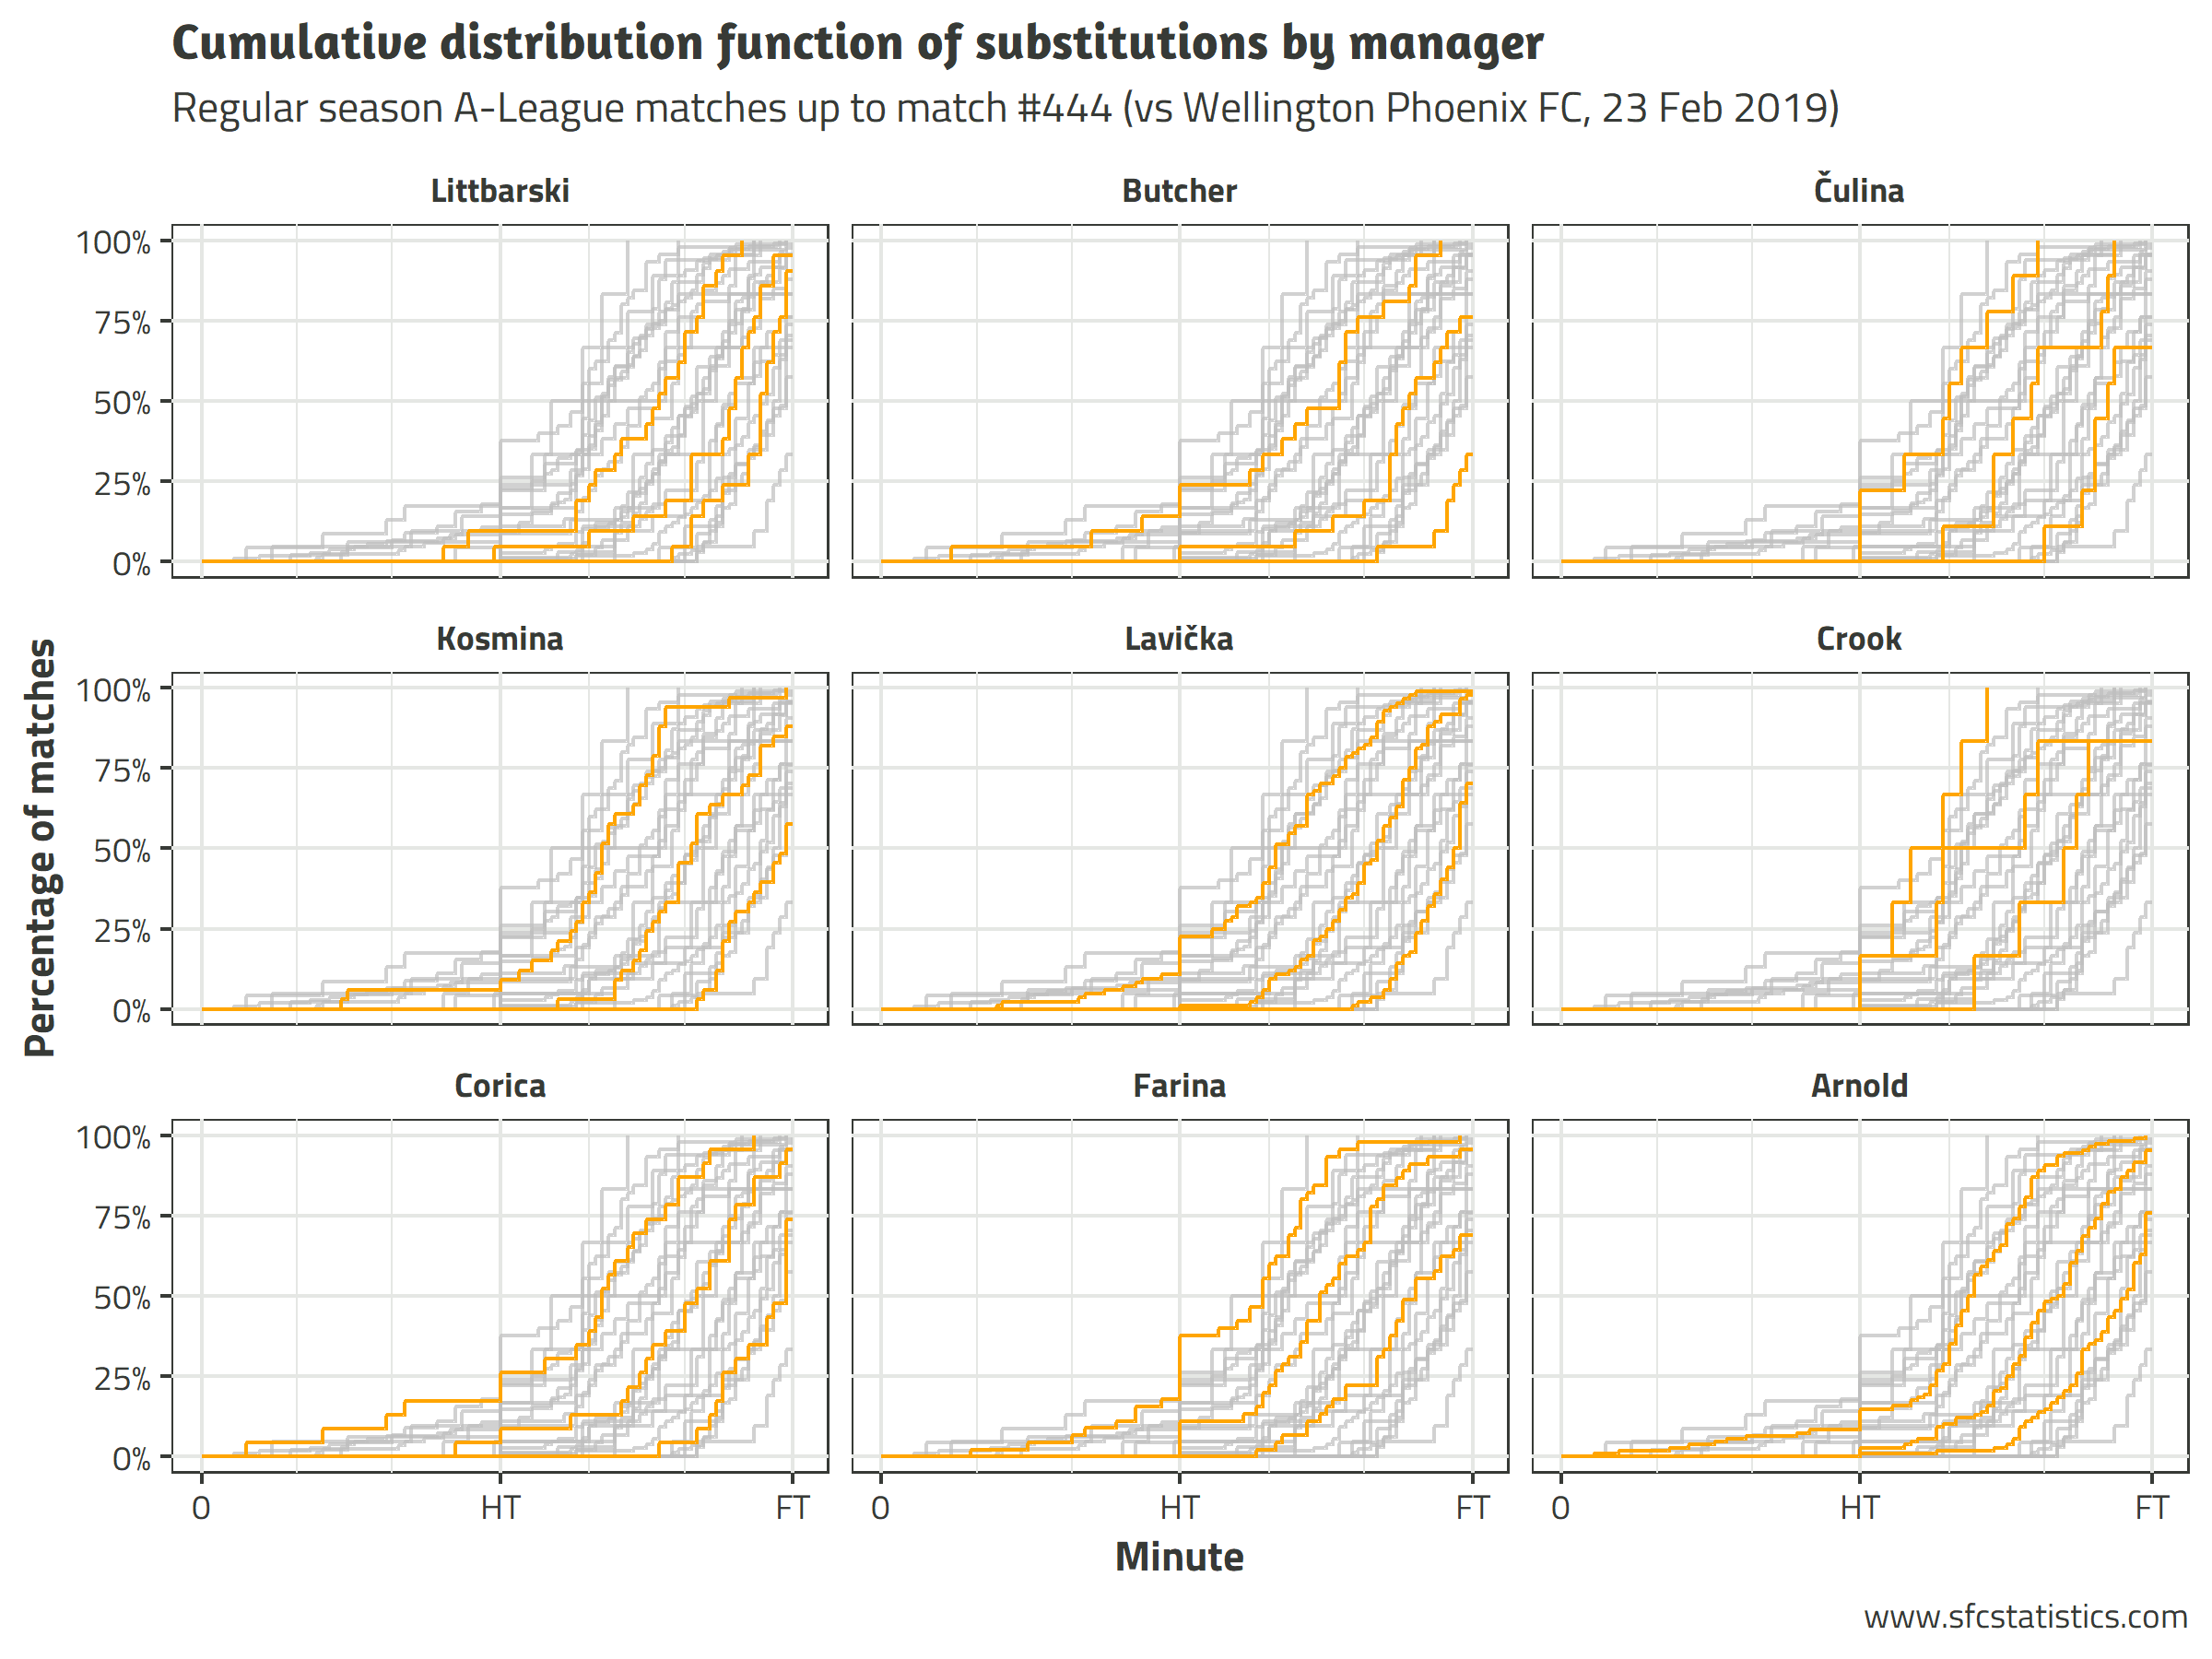
The same things pop out here: Terry Butcher only used his full bench in just over a quarter of his matches in charge, while Frank Farina had already made at least one change before the second half kicked off in around a third of his. The one additional thing I noticed from this graph is Corica’s penchant for using his third sub in injury time: his curve jumps from just below 50% to nearly 75% in that last moment, showing that he has done this in around a quarter of his matches.
Most popular substitutions
Well, there you go. Probably not the most interesting blog post of all time,2 but hopefully it was worth your time. You can leave your thoughts in the comments below or get in touch via Twitter.
To finish off I thought I’d include a bonus semi-related stat: the “favourite” substitutions made by each Sydney FC manager:
| Manager | Times used | Player off | Player on | Earliest | Latest | Average |
|---|---|---|---|---|---|---|
| Pierre Littbarski | 4 | Sasho Petrovski | David Zdrilić | 78 | 85 | 82 |
| David Carney | Robbie Middleby | 67 | 90 | 81 | ||
| 3 | (3 combinations) | — | — | — | ||
| Terry Butcher | 5 | David Zdrilić | Sasho Petrovski | 64 | 79 | 71 |
| 2 | David Zdrilić | Jeremy Brockie | 80 | 87 | 84 | |
| Mark Milligan | Ufuk Talay | 46 | 86 | 66 | ||
| Branko Čulina | 2 | Juninho | Patrick | 70 | 86 | 78 |
| 1 | (22 combinations) | — | — | — | ||
| John Kosmina | 3 | Steve Corica | Bobby Petta | 68 | 85 | 78 |
| 2 | (11 combinations) | — | — | — | ||
| Vítězslav Lavička | 6 | Karol Kisel | Brendan Gan | 66 | 85 | 77 |
| 5 | Steve Corica | Rhyan Grant | 72 | 90 | 79 | |
| Nick Carle | Sebastian Ryall | 78 | 90 | 84 | ||
| Bruno Cazarine | Juho Mäkelä | 53 | 79 | 68 | ||
| Ian Crook | 1 | (16 combinations) | — | — | — | |
| Steve Corica | 5 | Alex Brosque | Charles Lokoli-Ngoy | 75 | 86 | 82 |
| 4 | Paulo Retre | Danny De Silva | 57 | 79 | 68 | |
| 3 | Siem De Jong | Danny De Silva | 29 | 71 | 56 | |
| Reza Ghoochannejhad | Alex Brosque | 62 | 75 | 66 | ||
| Frank Farina | 3 | Ali Abbas | Joel Chianese | 55 | 72 | 64 |
| Blake Powell | Joel Chianese | 60 | 76 | 67 | ||
| Hagi Gligor | Matt Thompson | 61 | 79 | 72 | ||
| Joel Griffiths | Joel Chianese | 65 | 69 | 67 | ||
| Graham Arnold | 22 | Bobô | Matt Simon | 65 | 88 | 79 |
| 12 | Alex Brosque | Matt Simon | 26 | 88 | 73 | |
| Filip Hološko | Bernie Ibini | 56 | 73 | 66 | ||
I like that Butcher’s most commonly used change is the inverse of Littbarski’s. The fact that Graham Arnold has made the same subs far more often than any other manager is probably a function of the fact that he managed many more games than the rest, as well as the stability of his starting lineups over the record-breaking seasons. I don’t think the top sub will have come to anyone’s surprise.
Footnotes
- Notwithstanding the great only-in-the-A-League match in which Sydney FC couldn’t even make up a full bench
- And hopefully not the most interesting one I’ll ever do!