In what I hope becomes a regular feature on this site, I take a look back at the 2018–19 season for Sydney FC. Despite having less successful league campaigns, both the men’s and women’s teams added to Sydney’s trophy cabinet by winning their respective Grand Finals. I’ve put together a collection of stats from this season; let me know in the comments if there’s something more you’d like to see.
It’s a long one, so strap in…
Results
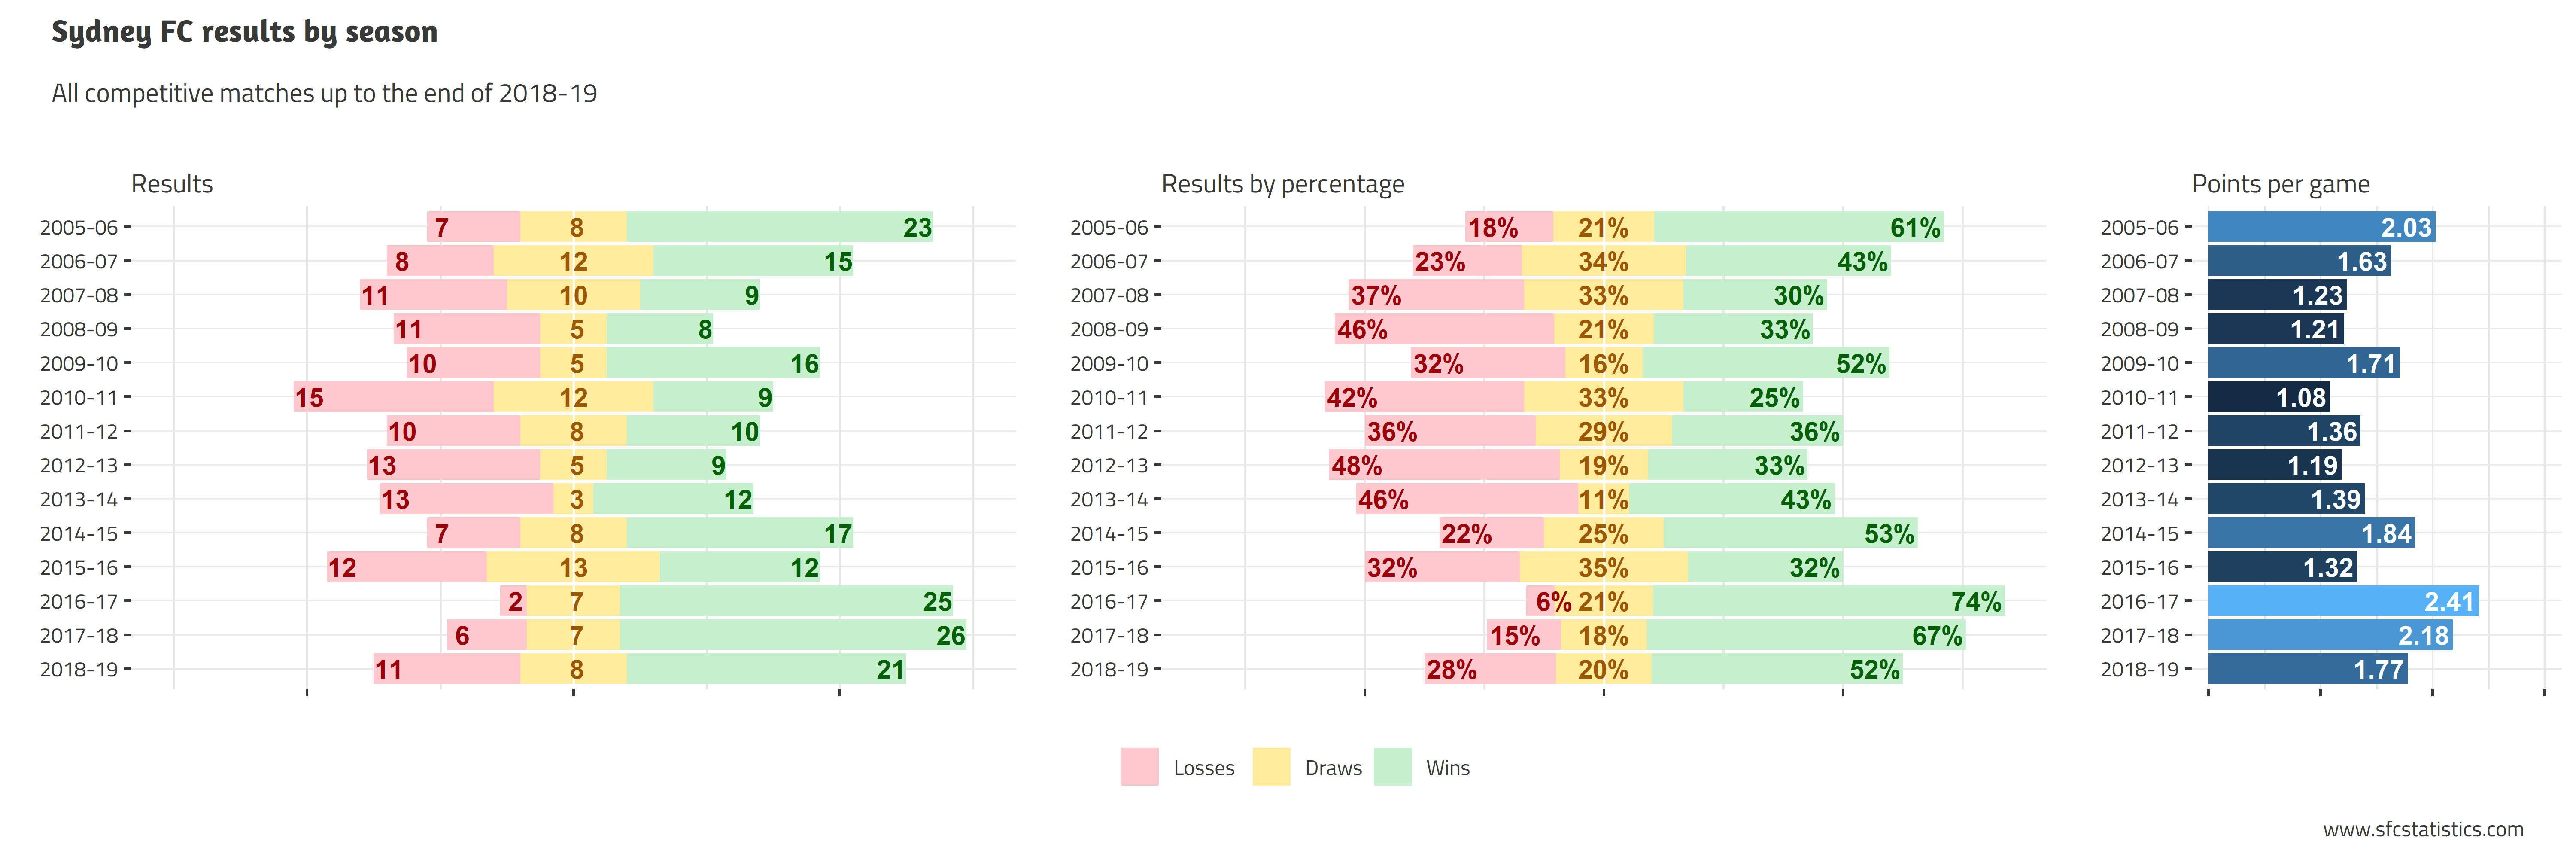
In reaching the Final of both the FFA Cup and the A-League, as well as competing in the AFC Champions League group stage, Sydney FC played a total of 40 competitive matches in 2018–19, the most they have in one season.
Results-wise, as shown in the graph below, it didn’t stack up to the incredible success of the previous two years, although the comparison with 2016–17 is a little distorted because SFC were not in the ACL that season. Sydney FC has won just one of their past 16 ACL matches — away to Suwon in 2018 — and over the past two campaigns have picked up just 3 points from 6 home matches. The points-per-game in 2005–06 is inflated somewhat thanks to the inclusion of the OFC Champions League.
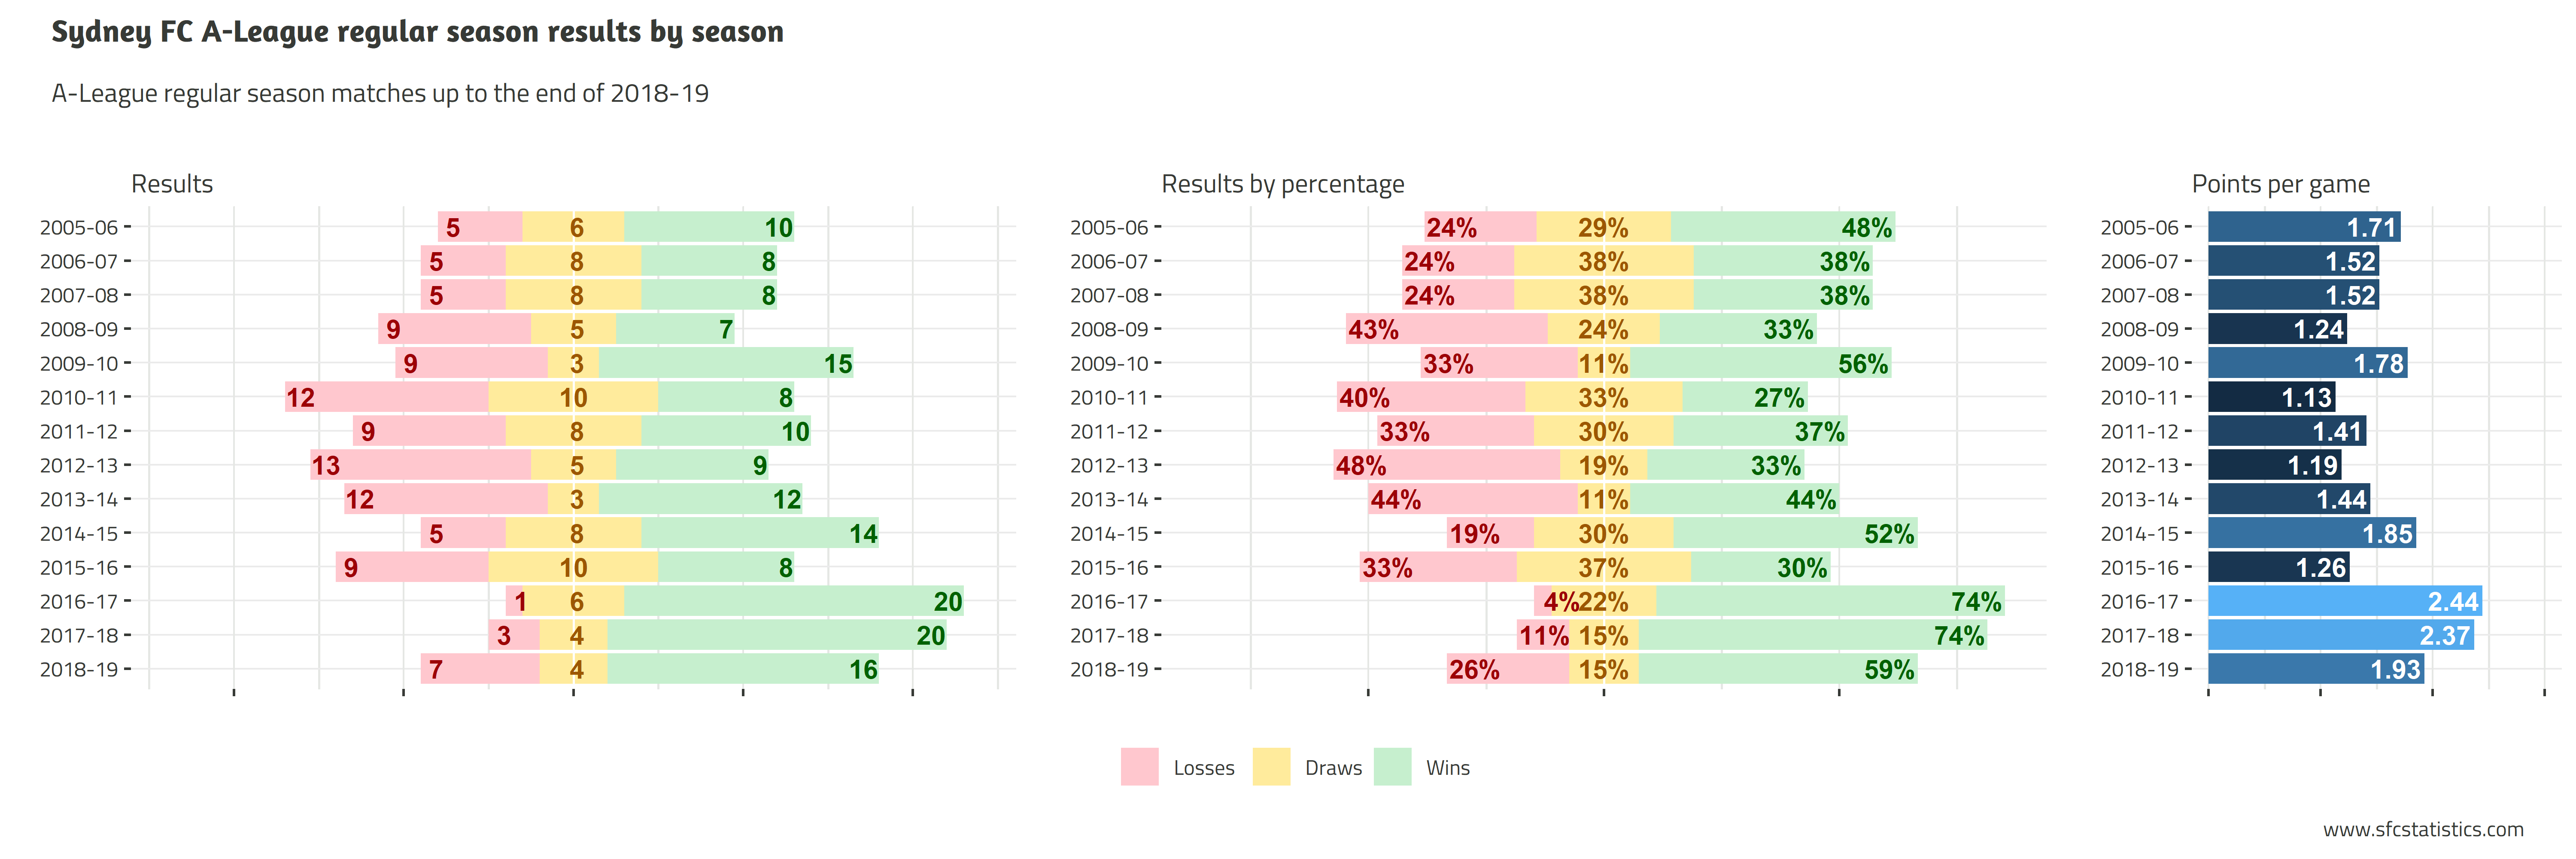
A fairer comparison across seasons includes just Sydney’s A-League regular season matches. This shows that 2018–19, while still no match for the last two seasons, was Sydney FC’s next highest points-per-game tally, edging out 2014–15 (2nd, lost Grand Final), 2005–06 (2nd, won Grand Final) and 2009–10 (1st, won Grand Final).
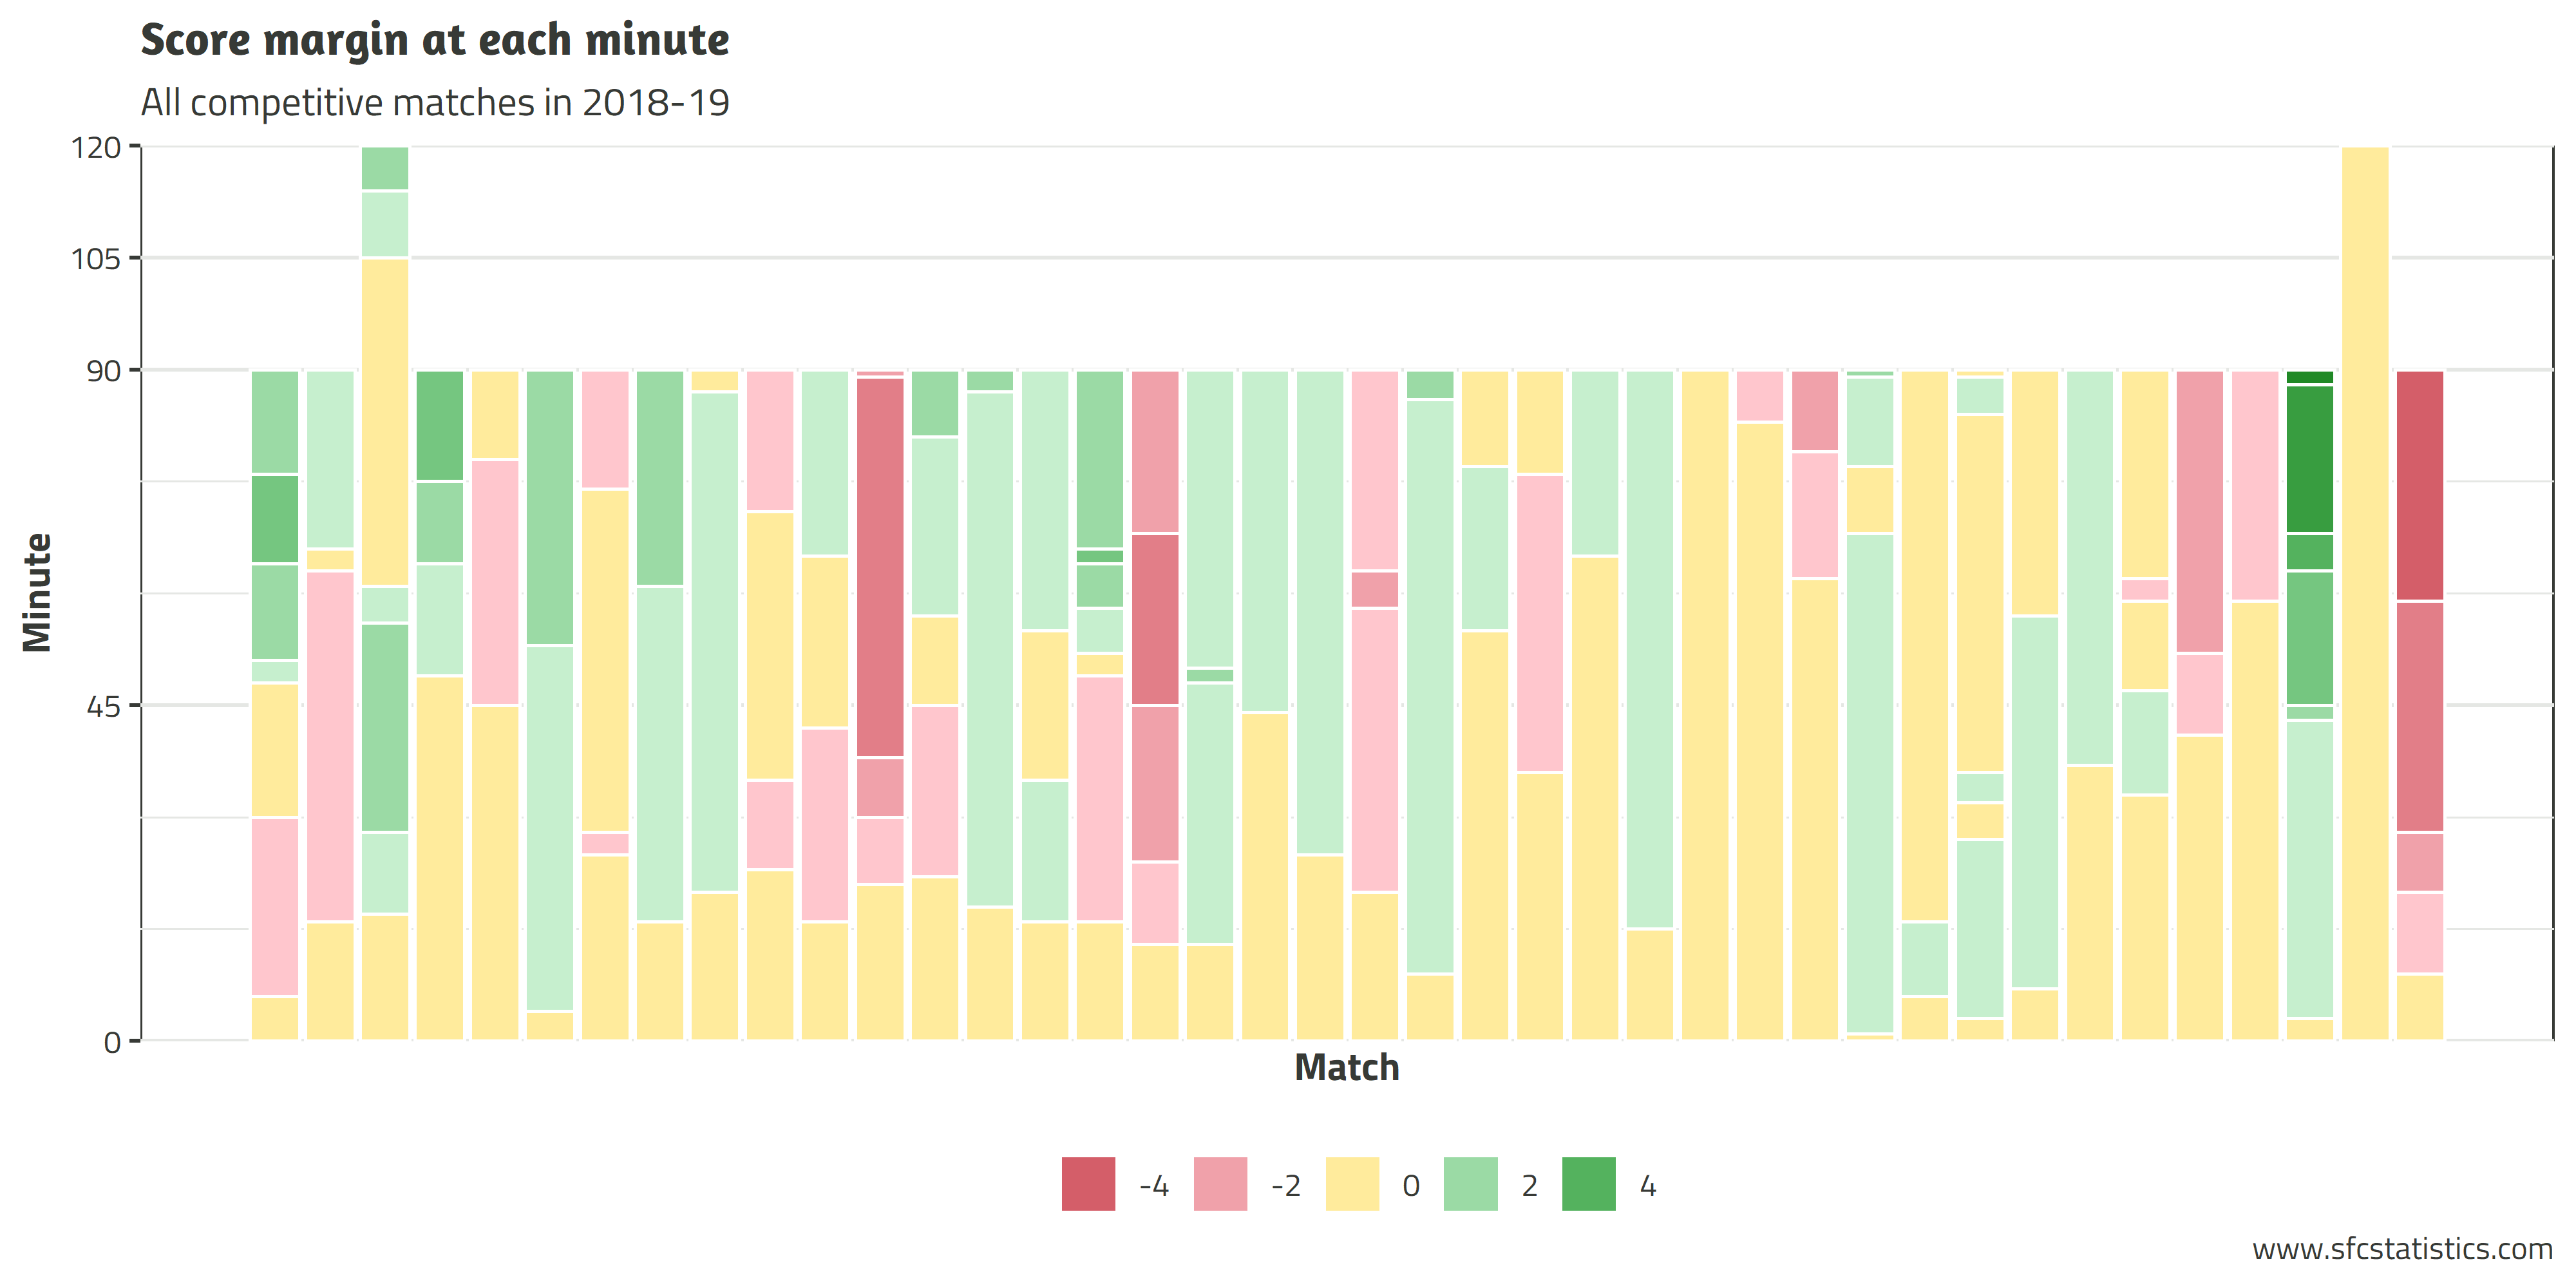
The following graph shows the margin at every minute of a match in 2018–19. The two ‘biggest’ wins (in terms of minutes led) were against their biggest rivals: the SCG win over WS Wanderers, when Adam Le Fondre opened the scoring in the fourth minute, and the Mothers’ Day Massacre of Melbourne Victory, with Aaron Calver’s opener coming in the third.
Sydney FC’s worst result came in the final ACL group match, against Kawasaki Frontale. After conceding in the 9th minute, they went on to record their worst-ever result in Asia, and the first time they lost by 4 or more goals in any competitive match since late 2013.
Sydney FC played out two scoreless draws during 2018–19, at home against Ulsan Hyundai in their first ACL match, and in the Grand Final against Perth. The 27 matches without a 0–0 result following the home match against Shanghai Shenhua last season is the third-longest such streak in Sydney’s history. Between February 2017 and January 2018 there were 31 Sydney matches featuring at least one goal, but this was well short of their overall record of 53 matches, lasting nearly two years from December 2012 to November 2014.
Sydney came back to win from a losing position five times this season: they conceded first against lower league opposition in their first two FFA Cup matches against Rockdale and Cairns, went behind in the 16th minute against the Mariners in both home and away matches, and scored three times following Vedran Janjetović’s brain snap at ANZ.
The last-minute loss away to Brisbane was the only match in which Sydney lost from a winning position, becoming just the second such occasion in the past three seasons.
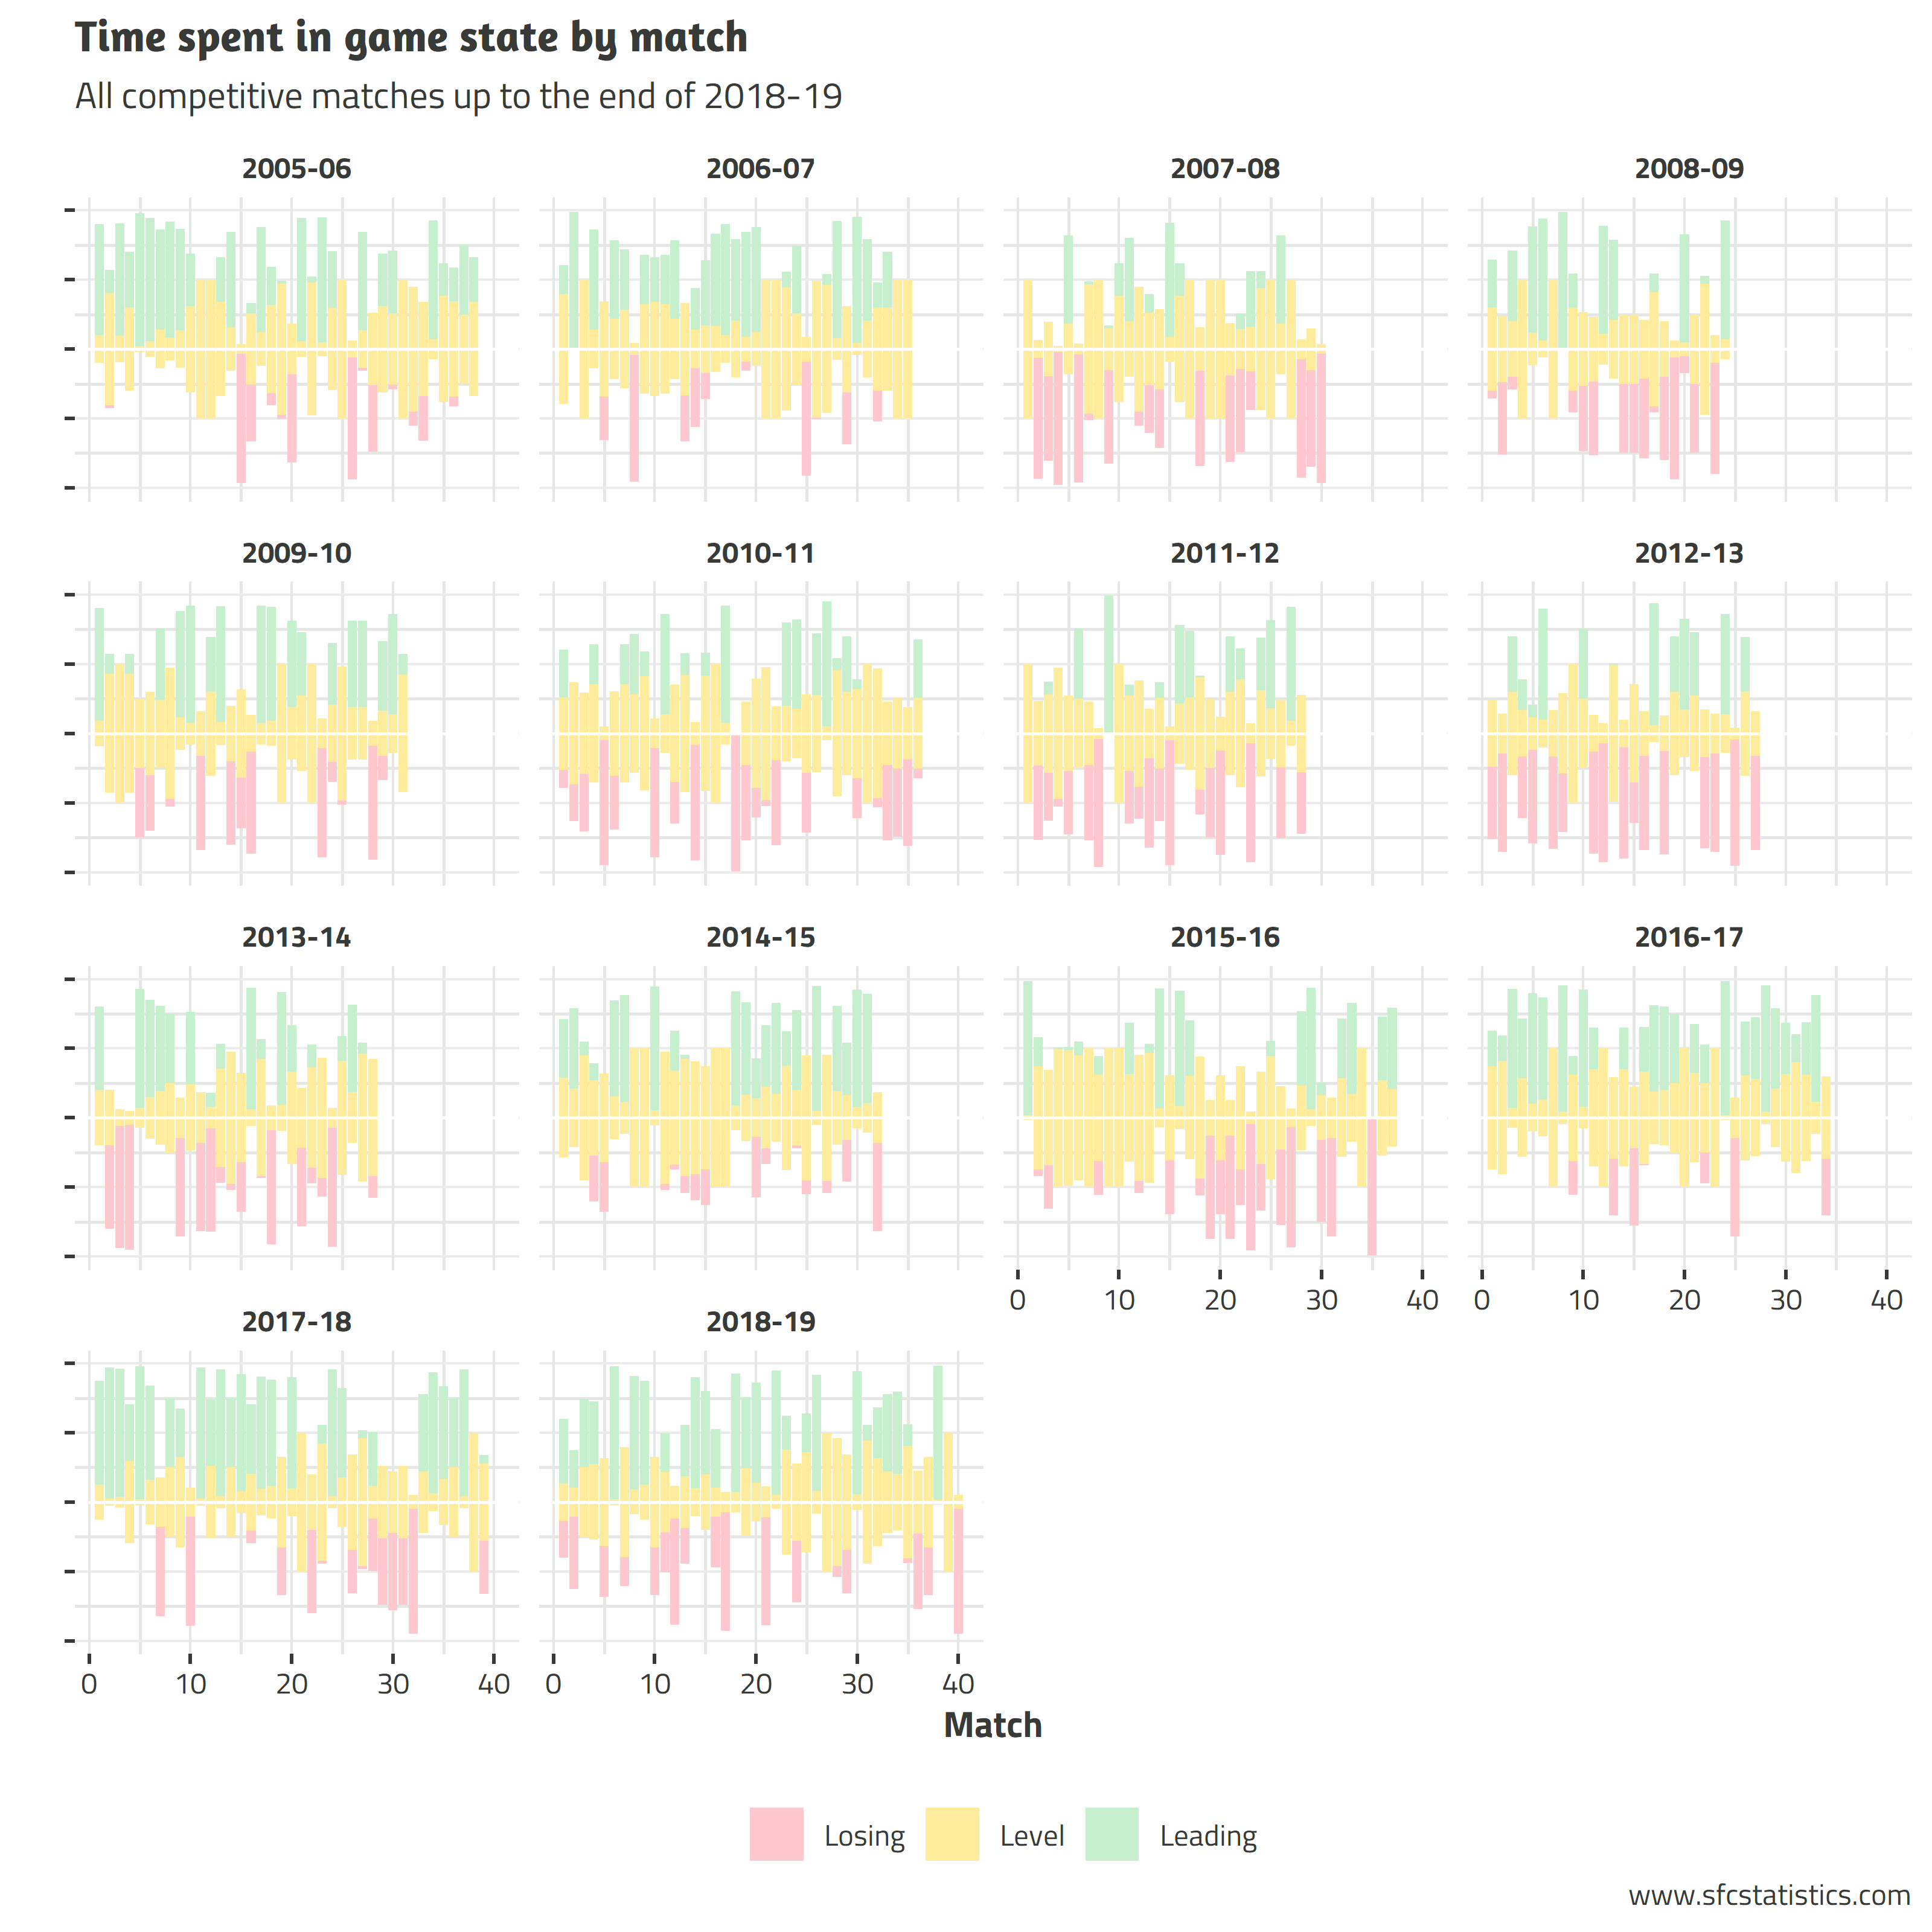
The following graph just shows the proportion of time spent in each game state (winning/drawing/losing) for each match. Sydney FC spent a little over 22 hours (1,333 minutes) in the lead of matches during the 2018–19 season: about 36% of the time. It’s their fourth-best season by that statistic, behind 2017–18 (45%) and 2016–17 and 2005–06 (both 39%). Although Sydney lost more matches in 2017–18 than 2016–17, you can see the gap in the time spent leading: it is the only season that they’ve spent more time in the lead than with the scores level.
Players
31 different players made it onto the field for Sydney FC in 2018–19: this is the highest number in the past 10 seasons. 25 of them featured in the starting line-up at some point, with the others (Charles Lokoli-Ngoy, Mitch Austin, Chris Zuvela, Alex Cisak, Jerry Skotadis and Marco Tilio) only making substitute appearances.
| Season | Matches | Players used | Starting players | Subs only |
|---|---|---|---|---|
| 2005–06 | 38 | 26 | 20 | 6 |
| 2006–07 | 35 | 30 | 22 | 8 |
| 2007–08 | 30 | 32 | 28 | 4 |
| 2008–09 | 24 | 31 | 29 | 2 |
| 2009–10 | 31 | 23 | 19 | 4 |
| 2010–11 | 36 | 26 | 24 | 2 |
| 2011–12 | 28 | 22 | 19 | 3 |
| 2012–13 | 27 | 30 | 29 | 1 |
| 2013–14 | 28 | 30 | 28 | 2 |
| 2014–15 | 32 | 27 | 25 | 2 |
| 2015–16 | 37 | 25 | 24 | 1 |
| 2016–17 | 34 | 24 | 21 | 3 |
| 2017–18 | 39 | 24 | 20 | 4 |
| 2018–19 | 40 | 31 | 25 | 6 |
Steve Corica put out 26 different starting line-ups across the 40 matches. His most commonly used eleven was that which played in seven consecutive matches between Rounds 2 and 7 of the league: Redmayne, Zullo, Wilkinson, Van Der Linden, Grant, Brillante, O’Neill, Ninković, Brosque, Le Fondre and Retre. Corica made an average of 1.7 changes to his starting lineup between matches, although this was inflated somewhat by the complications of playing in the ACL.1 Considering the A-League regular season only,2 the average of 1.3 was the 2nd-lowest average of any season.

This is not to say that Bimbi was necessarily any less of a tinkerer than previous managers: we would need to differentiate between those changes that were at the manager’s discretion and those that were forced by injury, suspension or national team duty. We are currently working on pulling this data together across Sydney’s history, which would allow us to make such comparisons.
In a previous blog post I had a look at Corica’s pattern of substition timing, which showed that he was very much in the typical range for a Sydney FC manager. In fact, his profile was almost identical to that of his predecessor, Graham Arnold. The most common substitutions in 2018–19 for Sydney FC each happened five times: Alex Brosque replacing Reza Ghoochannejhad (an average of 66 minutes into the match), Ghoochannejhad replacing Brosque (68 min), Danny De Silva replacing Paulo Retre (70 min), and Charles Lokoli-Ngoy replacing Brosque (82 min).
Apart from Trent Buhagiar (4 starts), Luke Ivanovic (2 starts) and Cameron Devlin (1 start), the player most likely to be replaced after starting was Siem De Jong, who only played the full match in 2 of his 16 starts. He was replaced an average of 69 minutes into the match, by a wide variety of players: most often by Anthony Cáceres (4 times), Danny De Silva (3 times) and Paulo Retre (3 times), and once each by Miloš Ninković, Reza Ghoochannejhad, Mitch Austin and Luke Ivanovic.
Unsurprisingly given the wholesale changes for the last ACL match, no player played in every match of the season, let alone every minute. Both Brandon O'Neill and Andrew Redmayne played — and started — in 39 of the 40 competitive fixtures. Redmayne was on the field for the most minutes of the two: he was only replaced once, when injured in the closing stages of the FFA Cup match against Rockdale. O’Neill was only subbed off in 3 matches, and played 3,533 (99%) of the available 3,570 minutes.
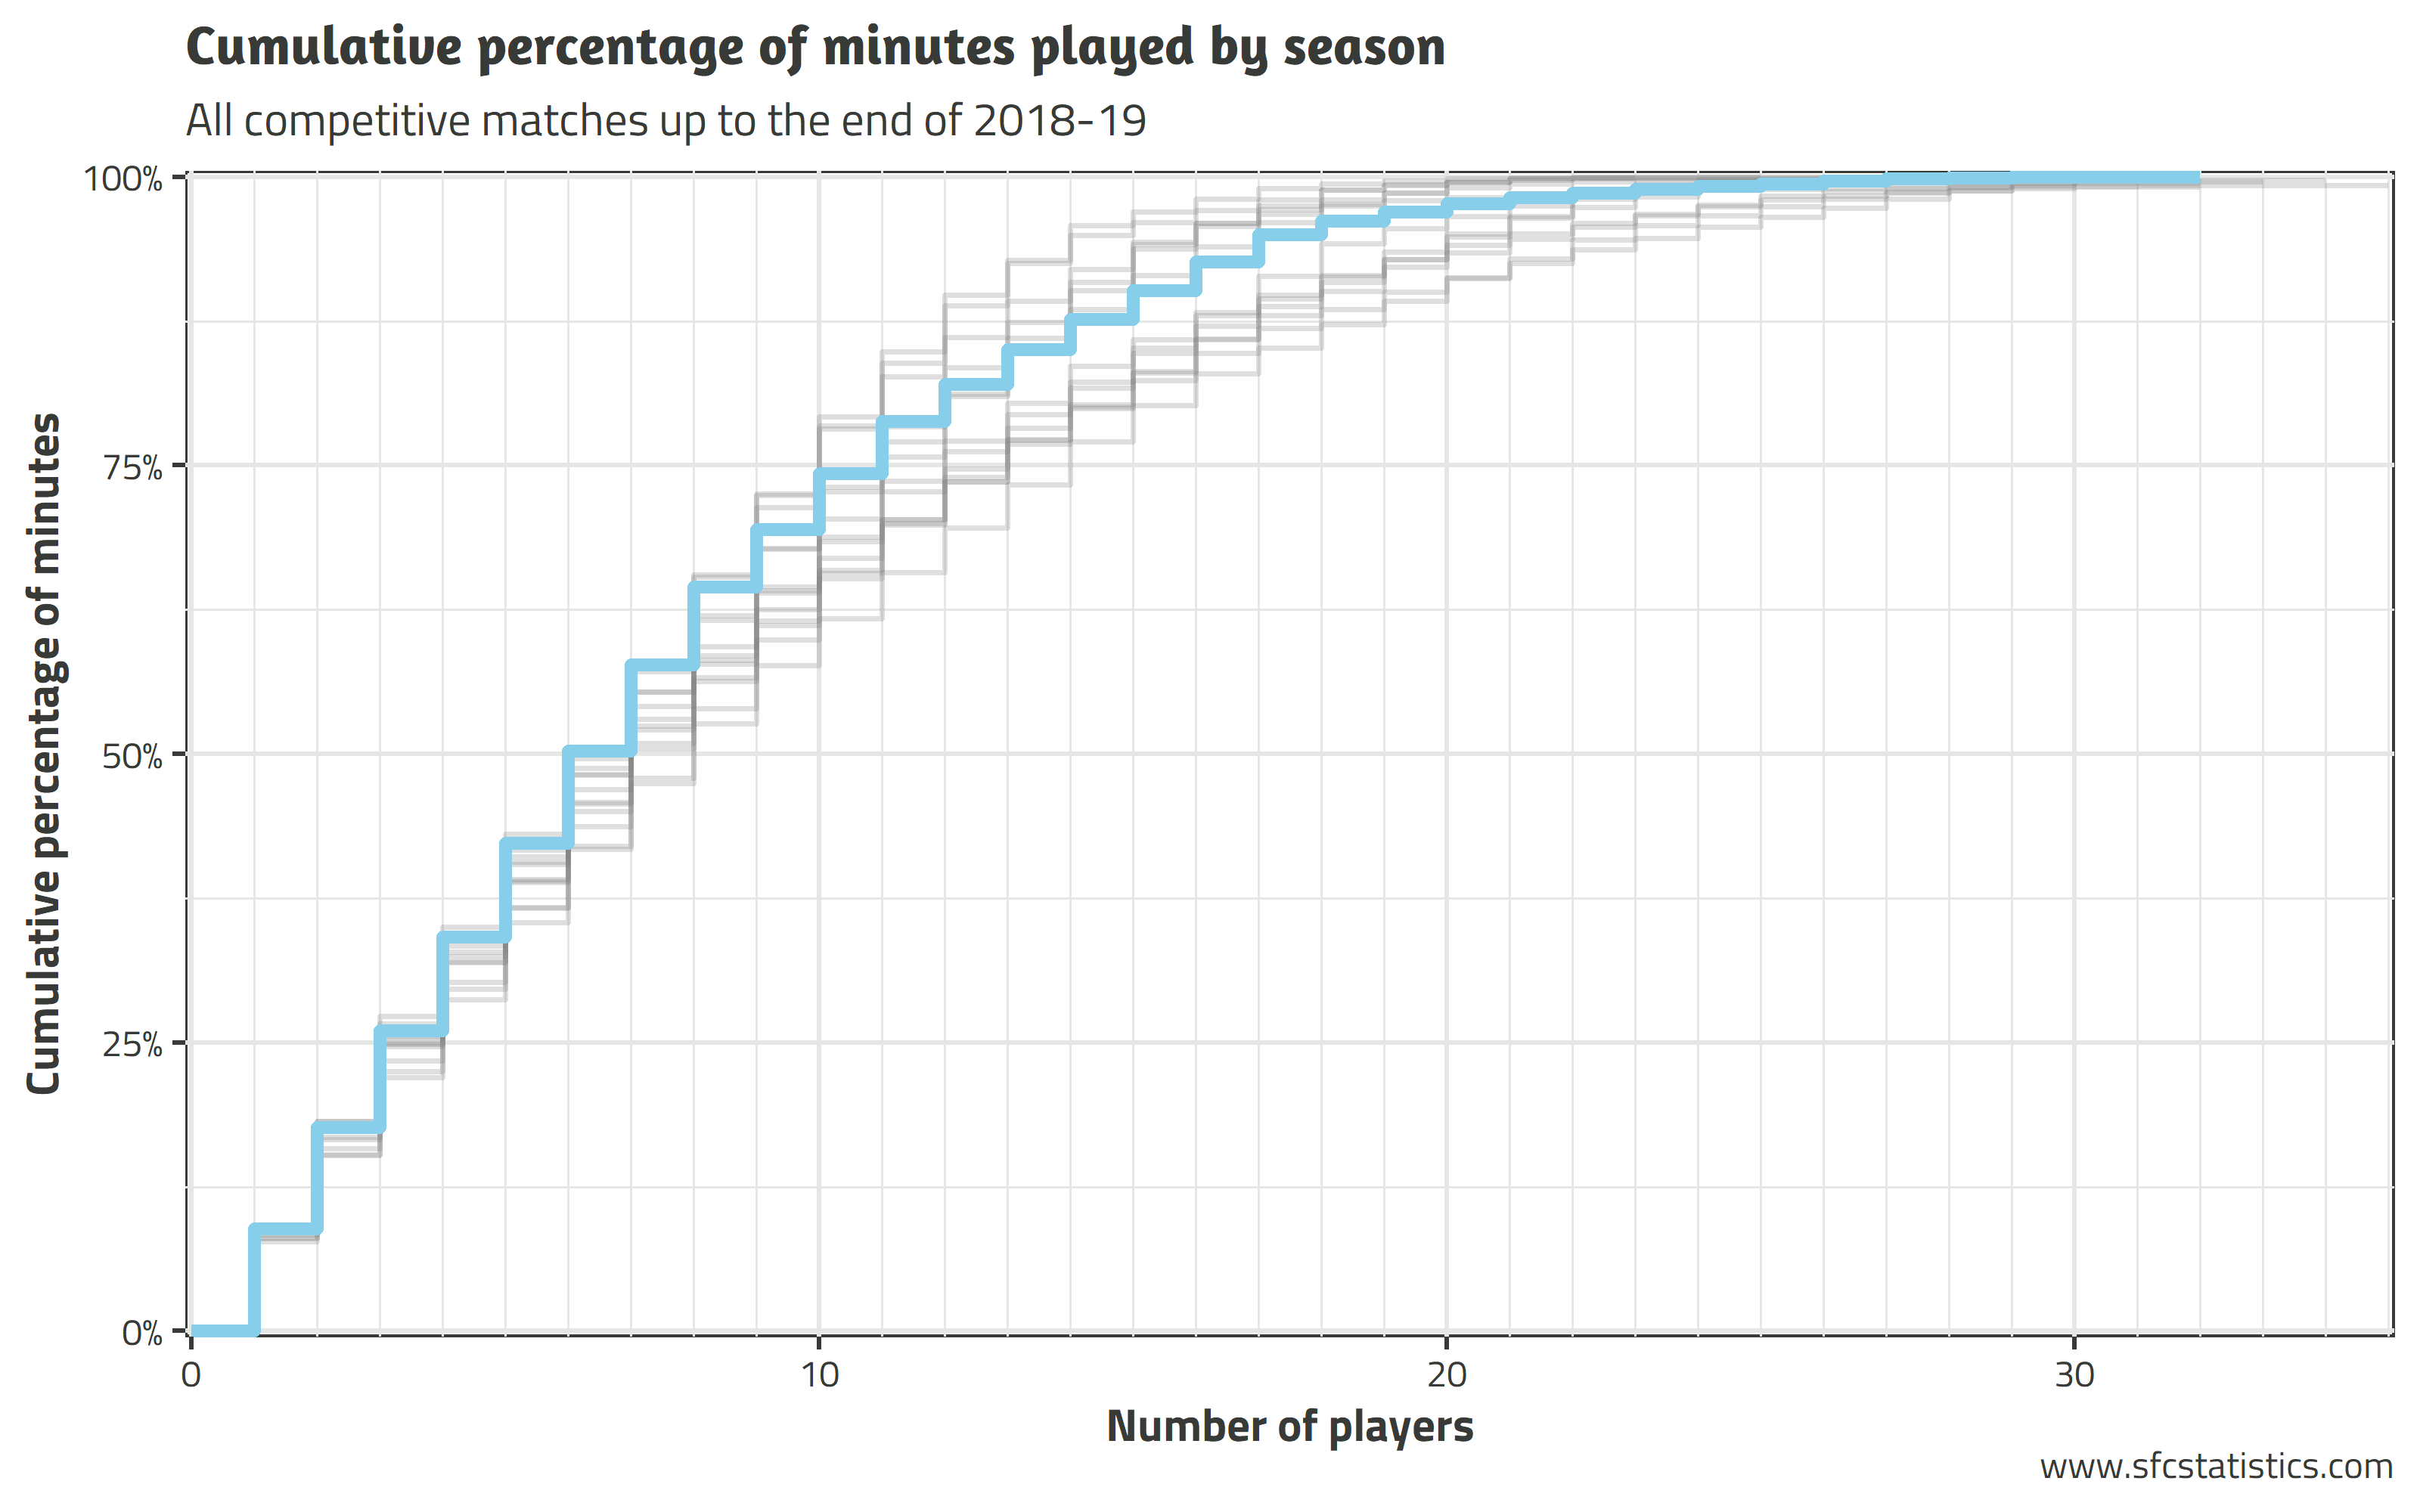
The graph above shows the cumulative percentage of the season’s minutes played by players who are sorted left-to-right from most to least used. Lines that are higher towards the left-hand side of the plot indicate seasons in which a core group of players contributed the most minutes. The highlighted line for 2018–19 shows that eleven players — Redmayne, O’Neill, Le Fondre, Wilkinson, Ninkovic, Brillante, Zullo, Grant, Brosque, Retre and Calver — played nearly 80% of Sydney’s competitive minutes last season.
Interestingly, the only three seasons in which eleven players played a higher proportion of the team’s minutes are the three in which Sydney finished as A-League Premiers: 2017–18 (85%), 2009–10 (84%) and 2016–17 (83%). The season with the lowest percentage on that statistic was 2012–13, where it was just 66%. Obviously there is a bit of chicken-and-egg in assigning causality here: is the team more successful with a stronger core, or does success lead to a more stable line-up?
One thing that is not obvious from the graph is that 2018–19 is actually the first season that the line reaches all the way to 100%. That is because Sydney went through the entire season without receiving a red card, the first such season in their history. The last red card to the Sydney FC player was Matt Simon‘s against Brisbane Roar in November 2017, 66 competitive matches ago. This is by far the longest such streak in SFC’s history, with the next best being a 36-game run from October 2011 to December 2012.
In terms of milestones, Alex Brosque made his 250th competitive appearance for Sydney in December against Brisbane, and ended his career with 267, which now stands as the all-time record. Miloš Ninković played his 100th in the first match of the season, against Rockdale in the FFA Cup, and Brandon O'Neill did the same in the very next round against Cairns. Alex Wilkinson and Joshua Brillante also reached their century in consecutive matches: Wilkinson against Perth in Kogarah and Brillante five days later away to Shanghai.
That brings to 14 the number of players with over 100 appearances for the club, with Michael Zullo just 5 games away from the mark, currently equal with Robbie Middleby on 95. Rhyan Grant is also just 5 games away from becoming the third player to appear 200 times for Sydney.
Goals
Sydney FC scored 68 goals in 2018–19, the fourth-highest tally for a season, or fifth in terms of goals per game (1.70). Alex Brosque‘s goal in first-half injury time against Western Sydney in Round 8 was Sydney FC’s 700th competitive goal: the current tally sits at 742.
The following graph shows the number of goals that Sydney FC scored and conceded in each 5-minute period of this season’s matches. 10 of Sydney’s 68 goals came between the 60th and 65th minutes, while they only conceded twice in that time during the season. Sydney conceded more (14) than they scored (9) between the 15th and 30th minutes: this is the only 15-minute period in which Sydney has had a negative goal differential since 2015–16 (0–15, 30–45 and 60–75).

In the first five minutes of matches in 2018–19, Sydney scored four goals and did not conceded any. Aaron Calvers opener against Brisbane came after just 40 seconds, and was the third-earliest goal that Sydney has ever scored. The only earlier goals were Shannon Cole‘s away to Melbourne in 2008 (26 seconds) and Dimitri Petratos‘ in the 2011 win over Brisbane at Kogarah (36 seconds).
Apart from the two goals scored in extra time against Avondale, Sydney’s latest goal of the season was Cameron Devlin‘s fence-breaker, 3:31 into injury time against Adelaide at Leichhardt Oval. Sydney scored two other injury-time goals in 2018–19: Adam Le Fondre‘s that made it 3–0 against Melbourne City away in Round 3, and Miloš Ninković‘s winner at the SCG against the other Melbourne team. Sydney conceded one in injury time as well against Victory, but I don’t think anyone really minded that much.3
Adam Le Fondre was the top goalscorer in 2018–19, netting 23 in his 37 appearances. This is the second-highest tally for any Sydney FC player in a single season, behind only Bobô‘s 2017–18 season, in which he scored a remarkable 36 in 38 appearances. The start to Alfie’s Sydney FC career was especially notable: he scored in all of his first six appearances, falling just one short of the record that Marc Janko set of scoring in seven consecutive matches during 2014–15.
The remaining 43 goals4 were shared between 14 different players, including 10 who scored their first for the club,5 two of them on competitive debut (Danny De Silva and Jacob Tratt).
The Gini coefficient is a well-known measure of economic inequality. It ranges from 0, representing perfect equality (all individuals having an equal share) to 1, representing the most extreme inequality (one individual having all of the wealth). We can do the same thing for goals scored, to see how evenly spread they were across the squad, adjusting for minutes played. The graph on the left-hand side below is the Lorenz curve of goals scored: the proportion of goals scored cumulatively against minutes played in each season, with 2018–19 highlighted.

The curve for a season with perfect equality would follow the dashed 45° line, such that a player appearing for particular proportion of the time would be expected to have scored the same proportion of the side’s goals. We would obviously never see this in reality,6 but lines that stretch further towards the bottom-right corner indicate greater inequality. The Gini coefficient is essentially a measure of how far each line stretches in that direction: those for each season are shown on the right-hand side.
By this measure, 2018–19 was the second-most unequal season: over 60% of Sydney’s goals (40 / 66, excluding opposition own goals) were scored by four players who were on the pitch for less than 10 percent of the total number of player-minutes: Cameron Devlin (1 in 133 minutes), Trent Buhagiar (4 in 290 minutes), Alex Brosque (12 in 2,007 minutes) and Adam Le Fondre (23 in 3,375 minutes). The season with the greatest equality by this measure was 2008–09, when 14 different players scored and the top scorer Alex Brosque finished with just six goals.
Adam Le Fondre converted 8 penalties in 2018–19, falling one short of the record of 9 that Bobô set in 2017–18. He also bundled home the one that Lawrence Thomas initially saved at Jubilee Stadium, and Alex Brosque scored another against Cairns to make it 10 from penalties (directly or indirectly) for the season. This was the second-highest number in a season, behind the 12 in 2017–187 and equal with 2014–15.8
The following graphs are ternary plots of the types of goals that Sydney FC has scored and conceded each season, with 2018–19 highlighted. The closer to a particular corner,9 the higher the proportion of goals scored of that type.
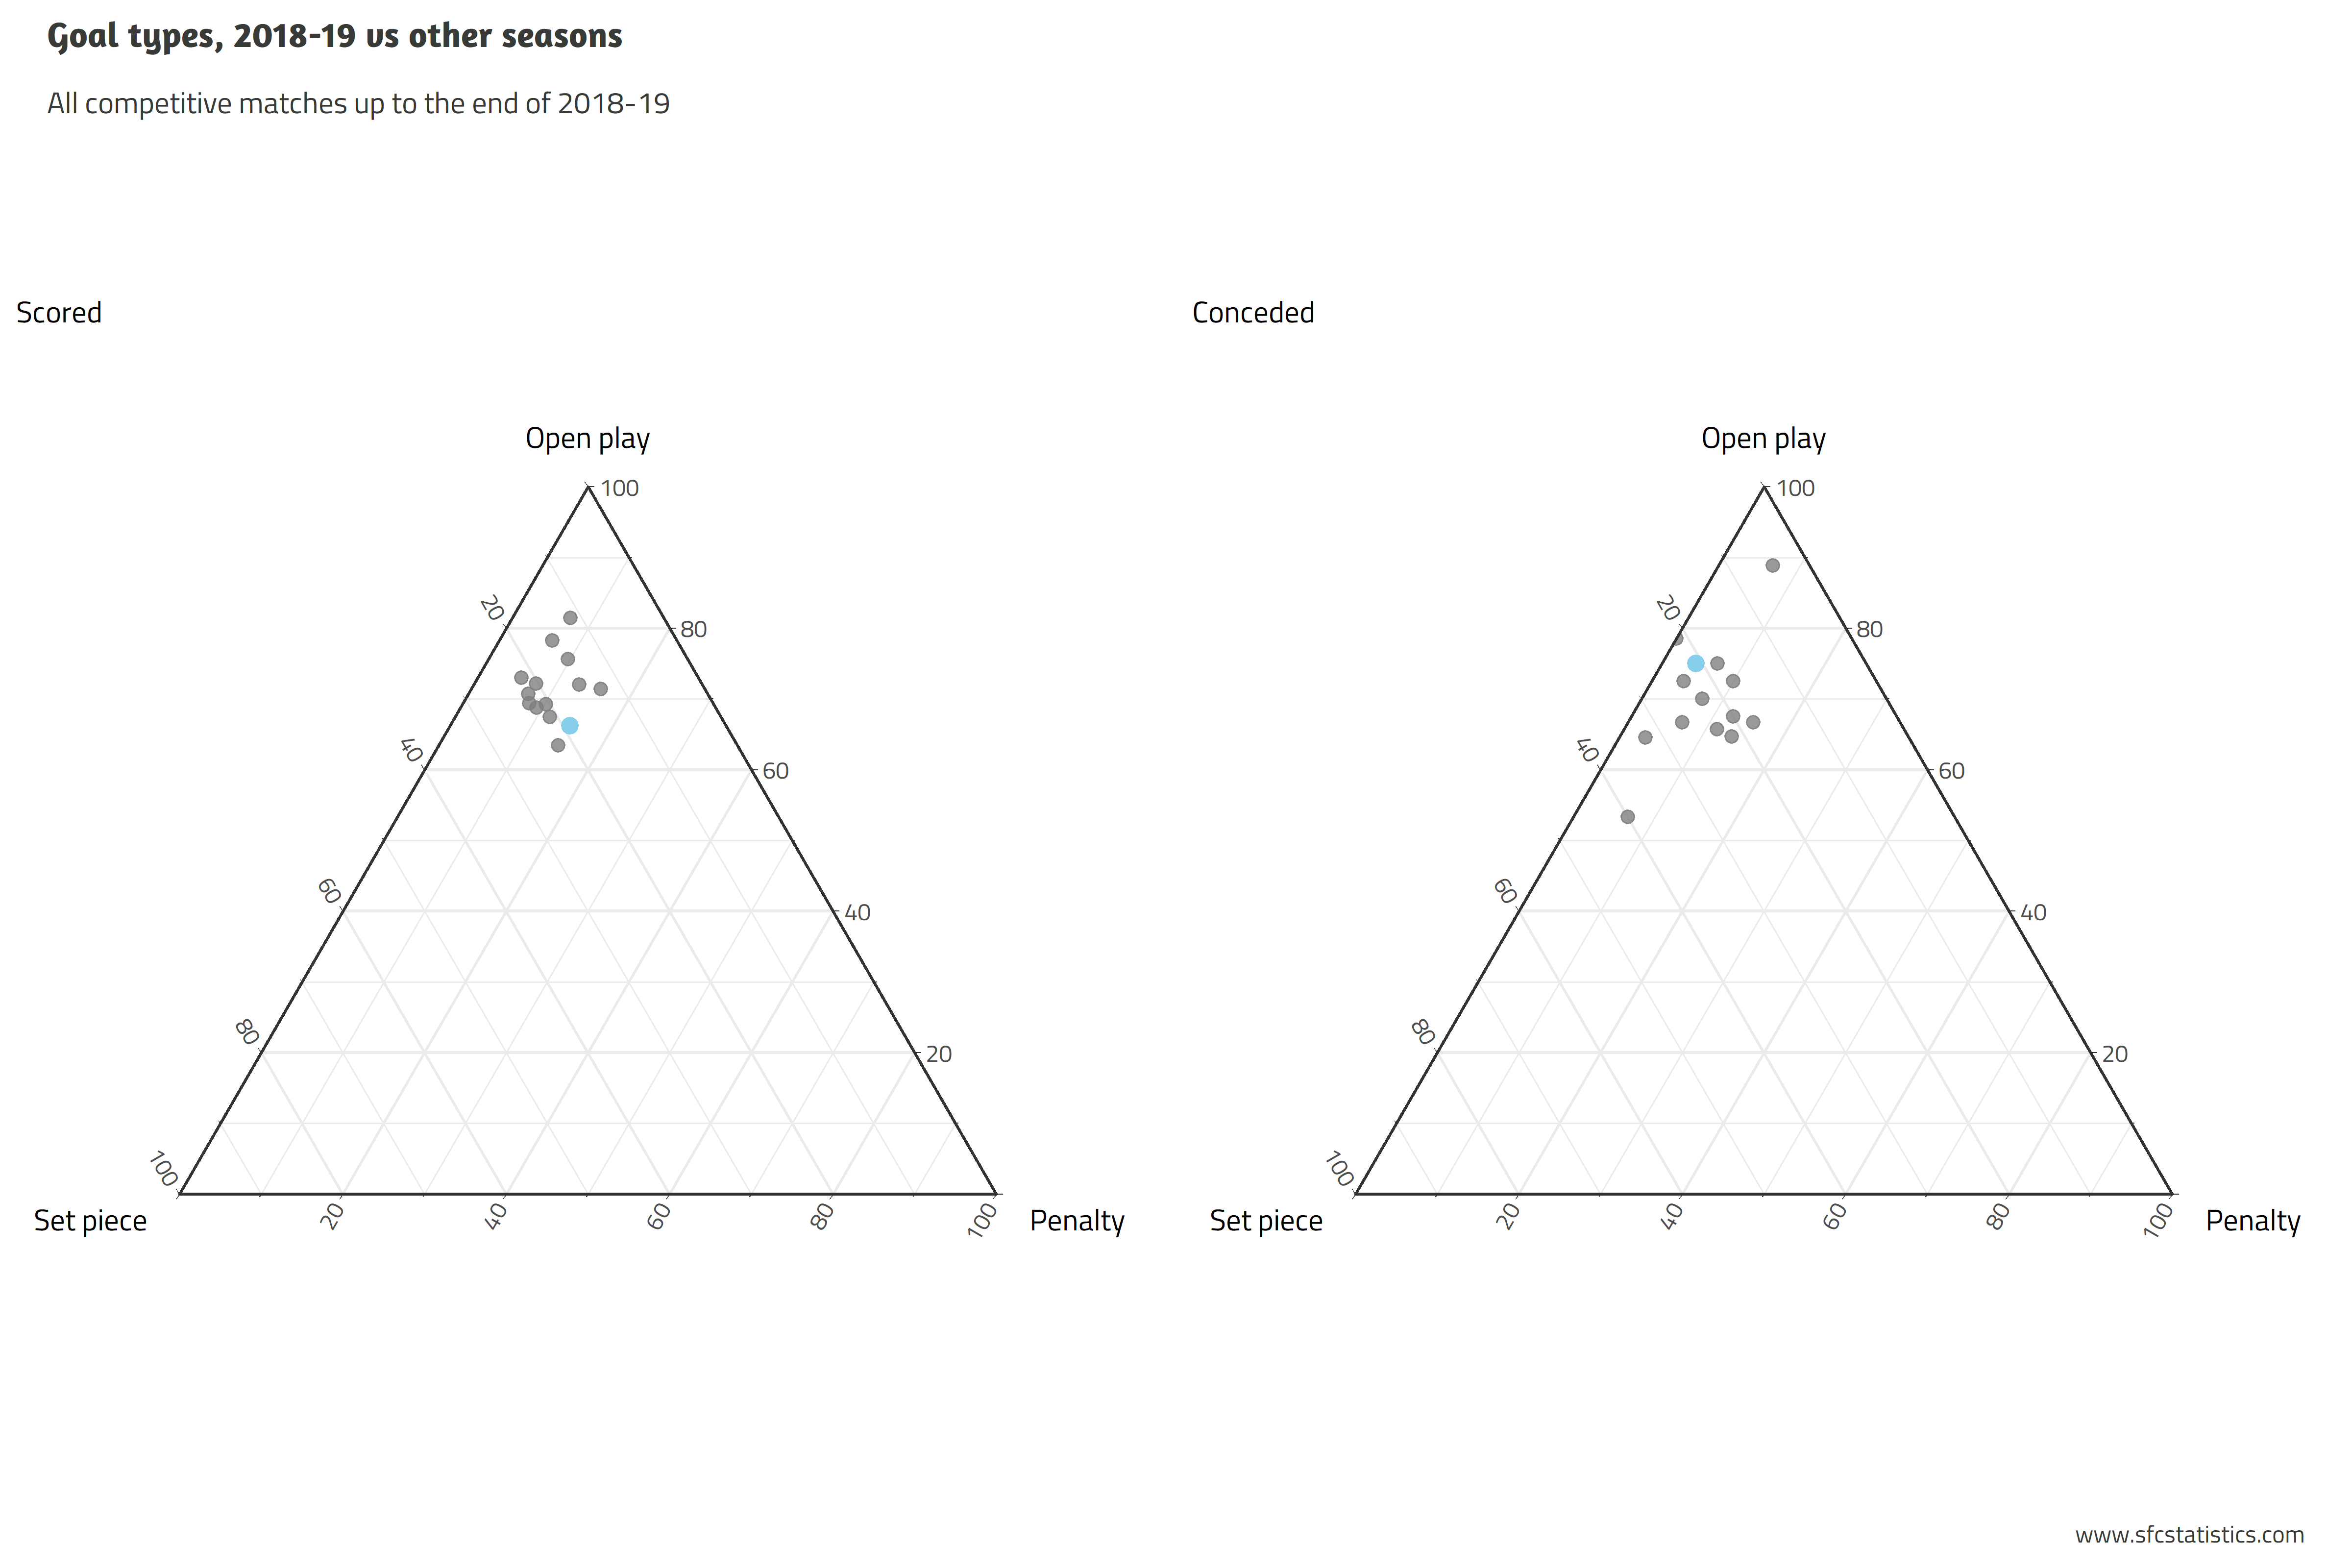
With 13 goals also coming from set pieces (9 corners10 and 4 free kicks), the remaining 45 from open play is the second-lowest such percentage (66%) in SFC history. On the other hand, 36 of the 48 goals Sydney conceded in 2018–19 were from open play (75%), the equal-third highest rate behind 2015–16 (89%) and 2016–17 (79%), and equal with 2014–15. The remaining 12 goals came from two penalties and 10 set pieces (5 corners and 5 free kicks).
In terms of the way in which goals were scored and conceded, shown in the following graph, 2018–19 sat around the middle of the pack. 23 goals were scored with the left foot (including 8 by Brosque, 4 by Le Fondre and 3 by O’Neill), 35 with the right foot (including 16 by Le Fondre and 4 by De Jong), 9 with the head (including 2 each by Calver, Le Fondre and Tratt) and 1 off the body (Le Fondre’s winner against Perth11).

Attendance
Even the most optimistic Sydney FC fan probably didn’t expect attendances to increase this season, given the move away from the SFS. But, as can be seen from the graph below, they didn’t drop off dramatically: the average in regular season A-League matches seems to have followed the same slow downwards trend that it has since the bump that came with the ADP signing.
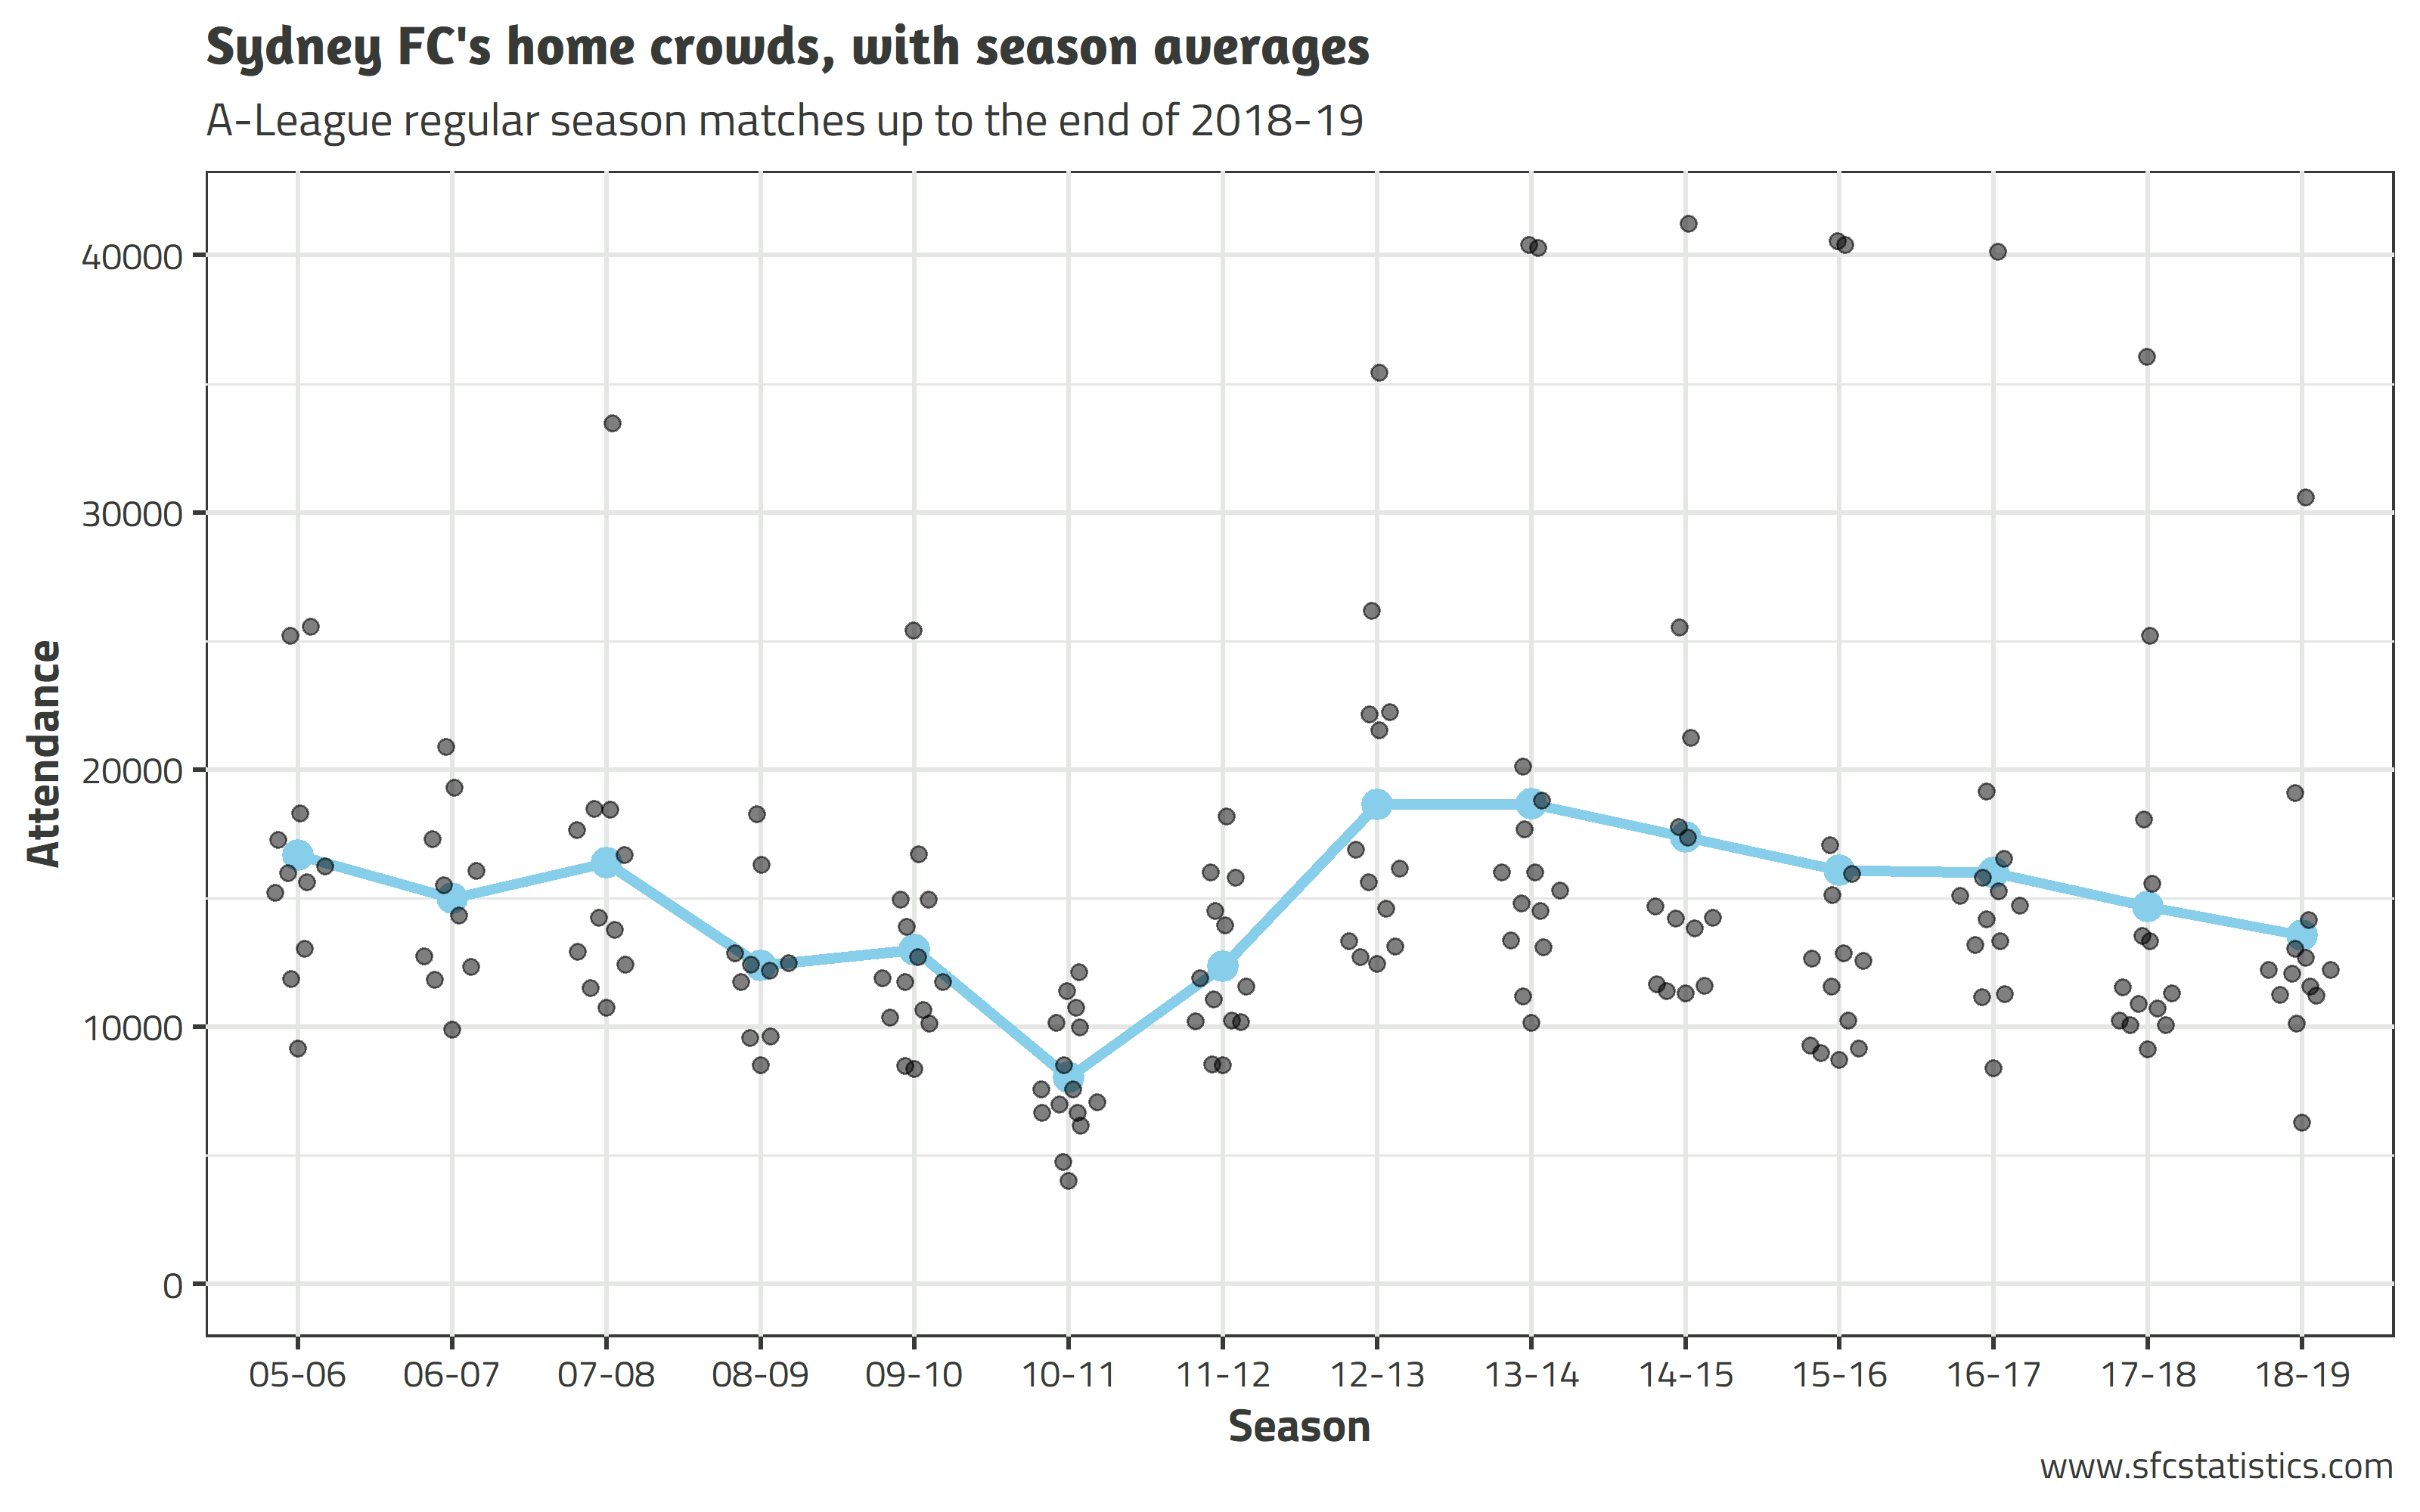
But there’s no doubt they were down: the largest home crowd of the season was the 30,588 that attended the SCG derby in Round 2. This is the smallest maximum since 2011–12, the season before our western friends joined the competition. Similarly, the smallest crowd of the season — 6,261 on a Sunday night in Leichhardt — is the lowest since 2011,12 and the fourth-lowest in Sydney FC history.
Crowds in the ACL were not great either: the 3,813 that came to Kogarah two days after the Grand Final win was Sydney’s lowest home crowd in the comp, and the third-lowest home crowd ever for SFC in any competition.13 Away from home, the game in Ulsan saw the smallest official crowd that Sydney has ever played in front of,14 falling 46 short of Avondale’s FFA Cup attendance this season.
On the plus side, 56,371 away in Perth set a new record for A-League Grand Final attendance. In Sydney FC’s competitive matches, only the Round 1 away derby in 2016–17 had a higher crowd: if we include friendlies, it is the seventh-highest crowd that Sydney has ever played in front of, behind matches against Chelsea (83,598), Arsenal (80,432), LA Galaxy (80,295), Liverpool (72,892) and Tottenham (71,549).
W-League
It would be remiss of me not to mention the women’s team. Despite only qualifying for the top 4 on goal difference — continuing their streak of never missing the finals in the W-League — they hosted and won the Grand Final against Perth Glory.
Looking at W-League regular season results:

2018–19 became the fourth consecutive season in which the W-League team picked up a solitary draw, and was the equal third-worst season in terms of points per game.
Looking at the scoreline at every minute of 2018–19:

Three of Sydney’s five losses came consecutively, in Rounds 2–4, and they were down by two goals by the 60th minute in all three. Sydney took all three points after trailing in one match, the 5–2 win over Adelaide in Round 7, while they lost after leading against Perth the following weekend.
Five players appeared in all of Sydney’s 14 matches in 2018–19. Sofia Huerta, who scored in both the semi-final and the Grand Final, played every minute of them. Captain Teresa Polias was only subbed off twice: deep into injury time against Canberra United and with just two minutes remaining against Perth away. The others were top-scorer Caitlin Foord, Chloe Logarzo, and import Savannah McCaskill.
Princess Ibini appeared in 13 matches, only missing the Round 1 derby, but she only played the entire match once. Of her 8 starts, she was substituted on 7 occasions, most often for Lisa De Vanna (3 times), which was the equal most common substitution made by Ante Juric this season. The other also involved the same players, with Ibini coming on for De Vanna in 3 of her 6 starts.
Teresa Polias remains the only player to have made over 100 appearances for the Sydney FC women’s side, and extended her total to 118 this season. Amy Harrison made her 50th appearance in December, becoming the 12th player to make that milestone. After returning from a season at Melbourne City, Alanna Kennedy also reached the mark, in the semi-final win over Brisbane.
The top goalscorer for the season was Caitlin Foord, who scored 10 in her 14 appearances. She is only the third SFC women’s player to hit double figures in a season, with Kyah Simon in 2010–11 (12 goals) and Jodie Taylor in 2013–14 (11) the only players to have scored more. Foord’s goals tended to come in bunches, including a hat-trick and three braces, and she now sits third behind Leena Khamis and Kyah Simon on the all-time top goalscorers list. Last season’s joint top scorer Lisa De Vanna failed to notch a single goal this season, despite making 12 appearances.
Acknowledgements
I used R to produce the graphs and analyses in this post. Thanks to these package maintainers in particular: the R Core Team (base, compiler, datasets, graphics, grDevices, grid, methods, nlme, stats, tools, utils), Achim Zeileis (colorspace), Alex Hayes (broom), Aron Eklund (beeswarm), Baptiste Auguie (gridExtra), Brian Ripley (boot, MASS), Charlotte Wickham (munsell), Claus O. Wilke (cowplot), Deepayan Sarkar (lattice), Dirk Eddelbuettel (digest, Rcpp), Eduardo L. T. Conceicao (DEoptimR), Erik Clarke (ggbeeswarm), Gábor Csárdi (cli, crayon, pkgconfig), Hadley Wickham (assertthat, dplyr, forcats, ggplot2, gtable, haven, httr, lazyeval, modelr, plyr, proto, rvest, scales, stringr, tidyr, tidyverse), Hiroaki Yutani (gghighlight), James Hester (xml2), Jeffrey B. Arnold (ggthemes), Jennifer Bryan (cellranger, readxl), Jens Oehlschlägel (bit, bit64), Jeremy Stephens (yaml), Jeroen Ooms (jsonlite), Jim Hester (glue, odbc, readr, withr), Joe Cheng (htmltools), Justin Talbot (labeling), K. Gerald van den Boogaart (compositions, tensorA), Kevin Ushey (rstudioapi), Kirill Müller (blob, DBI, hms, pillar, RMariaDB, tibble), Lionel Henry (purrr, rlang, tidyselect), Marek Gagolewski (stringi), Maria Rizzo (energy), Martin Maechler (robustbase), Max Kuhn (generics), Michel Lang (backports), Nicholas Hamilton (ggtern), Peter Rossi (bayesm), Scott Sherrill-Mix (vipor), Stefan Milton Bache (magrittr), Stefano Meschiari (latex2exp), Vitalie Spinu (lubridate), Winston Chang (extrafont, extrafontdb, R6, Rttf2pt1), Yihui Xie (evaluate, highr, knitr, rmarkdown, xfun).
Footnotes
- The final ACL match against Kawasaki was the first time in SFC’s history that the entire starting line-up was changed between consecutive matches.
- And not counting the first match of each season.
- Least of all Paulo Retre, judging by his effort to stop Ola Toivonen from having a free header.
- There were also two own goals scored by the opposition.
- Siem De Jong, Trent Buhagiar, Aaron Calver, Danny De Silva, Jacob Tratt, Cameron Devlin, Reza Ghoochannejhad, Luke Ivanovic, Paulo Retre and Ben Warland
- Especially as goalkeepers are included.
- Adrian Mierzejewski scored the other three
- Four different players converted penalties in 2014–15: Marc Janko (4), Shane Smeltz (3), Ali Abbas (2) and Miloš Dimitrijević (1).
- In the direction pointing perpendicular to the opposite side.
- Including all 3 in the Round 8 win over WSW.
- I’ve watch the video far too many times, and while I’m sure he didn’t touch it with the left foot he swung at it, I’ve got no idea what it hit last.
- Remembering that this season’s match in Campbelltown was officially a Wellington home game, and in 2012 vs Perth it was a ‘neutral’ venue as part of the Regional Round.
- Ahead of the 2005 Pre-Season Cup semi-final (3,424) and the 2014 FFA Cup quarter-final (3,536).
- An approximate 1,500 in Tahiti aside.